
- Start >
- Rivers >
- Discharge >
- Bayern >
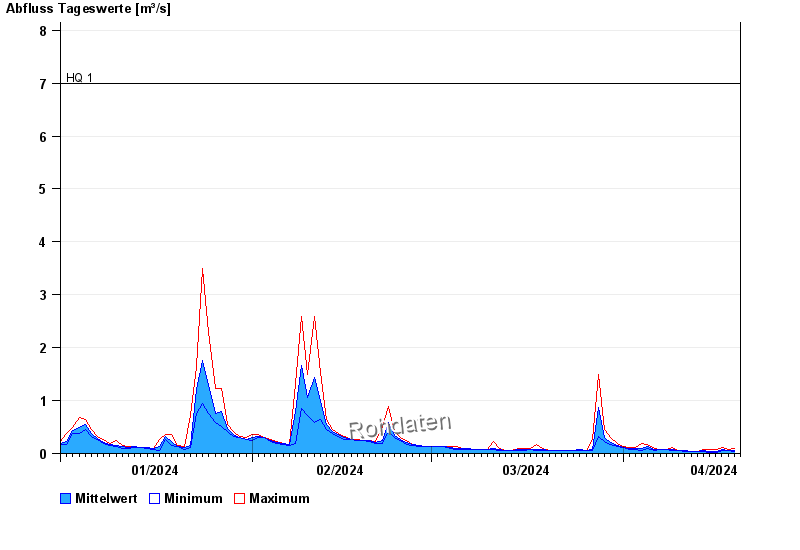
- Weiboldshausen >
- Chart of year

Chart of year Weiboldshausen / Felchbach
Discharge from 01.01.2024 to 19.04.2024
note
Wasserstand und Abfluss wird zeitweise durch Biberdamm beeinflusst.
- HQ1 7 m³/s
- HQ2 11 m³/s
- HQ5 12 m³/s
- HQ10 14 m³/s
- HQ20 17 m³/s
- HQ50 20 m³/s
- HQ100 23 m³/s
| Date | Mean value [m³/s] | Maximum [m³/s] | Minimum [m³/s] |
|---|---|---|---|
| 19.04.2024 | 0.054 | 0.054 | 0.054 |
| 18.04.2024 | 0.065 | 0.074 | 0.054 |
| 17.04.2024 | 0.079 | 0.111 | 0.054 |
| 16.04.2024 | 0.046 | 0.074 | 0.026 |
| 15.04.2024 | 0.046 | 0.085 | 0.021 |
| 14.04.2024 | 0.048 | 0.074 | 0.046 |
| 13.04.2024 | 0.046 | 0.046 | 0.046 |
© Bayerisches Landesamt für Umwelt 2024