

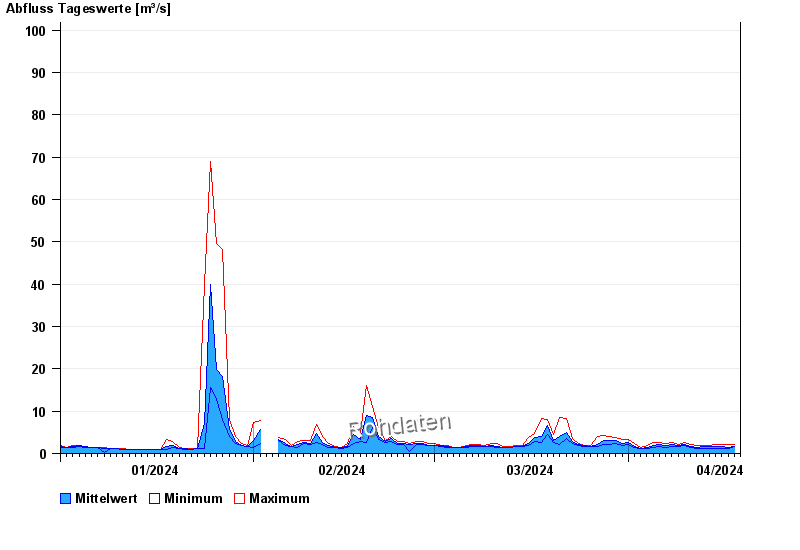
Chart of year Walchen / Walchen
Discharge from 01.01.2024 to 18.04.2024
- 23.08.2005 Abfluss: 210 m³/s
- 22.05.1999 Abfluss: 199 m³/s
- 03.06.2010 Abfluss: 150 m³/s
- 12.08.2002 Abfluss: 147 m³/s
- 22.12.1991 Abfluss: 143 m³/s
| Date | Mean value [m³/s] | Maximum [m³/s] | Minimum [m³/s] |
|---|---|---|---|
| 18.04.2024 | 1.64 | 1.8 | 1.57 |
| 17.04.2024 | 1.5 | 2.06 | 1.11 |
| 16.04.2024 | 1.57 | 2.2 | 1.11 |
| 15.04.2024 | 1.62 | 2.2 | 1.28 |
| 14.04.2024 | 1.57 | 1.92 | 1.28 |
| 13.04.2024 | 1.54 | 1.92 | 1.28 |
| 12.04.2024 | 1.49 | 1.8 | 1.28 |
© Bayerisches Landesamt für Umwelt 2024