

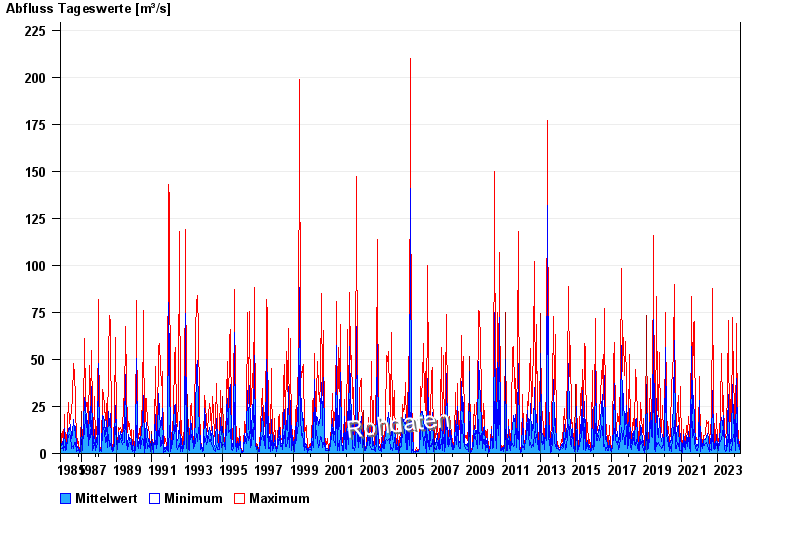
Chart of total period Walchen / Walchen
Discharge from 01.11.1985 to 25.04.2024
| Date | Mean value [m³/s] | Maximum [m³/s] | Minimum [m³/s] |
|---|---|---|---|
| 25.04.2024 | 1.99 | 2.85 | 1.8 |
| 24.04.2024 | 1.74 | 1.92 | 1.68 |
| 23.04.2024 | 1.88 | 2.06 | 1.8 |
| 22.04.2024 | 2.27 | 2.85 | 2.06 |
| 21.04.2024 | 2.49 | 3.03 | 2.06 |
| 20.04.2024 | 3.35 | 4.26 | 2.51 |
| 19.04.2024 | 2.06 | 3.41 | 1.68 |
© Bayerisches Landesamt für Umwelt 2024