

Chart of total period Walchen / Walchen
Discharge from 01.11.1985 to 16.04.2024
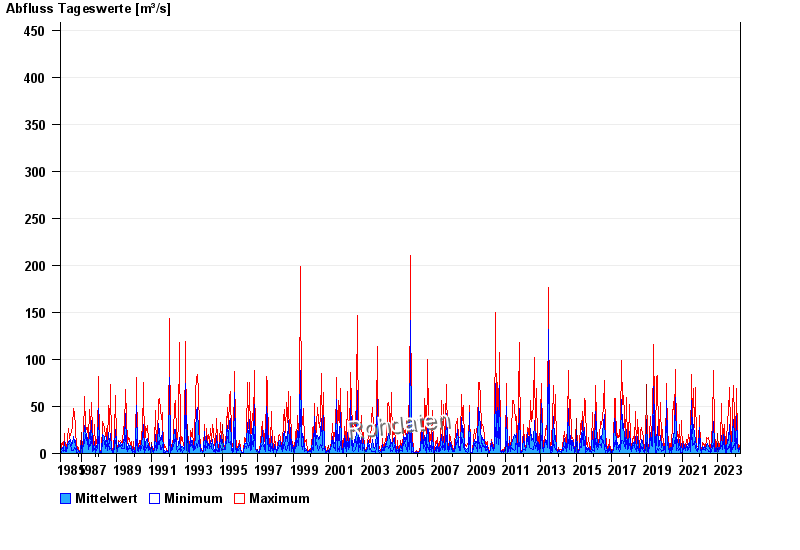 Für diesen Pegel sind keine Jährlichkeiten hinterlegt.
| Date | Mean value [m³/s] | Maximum [m³/s] | Minimum [m³/s] |
|---|---|---|---|
| 16.04.2024 | 1.66 | 2.2 | 1.19 |
| 15.04.2024 | 1.62 | 2.2 | 1.28 |
| 14.04.2024 | 1.57 | 1.92 | 1.28 |
| 13.04.2024 | 1.54 | 1.92 | 1.28 |
| 12.04.2024 | 1.49 | 1.8 | 1.28 |
| 11.04.2024 | 1.7 | 2.2 | 1.37 |
| 10.04.2024 | 2.13 | 2.51 | 1.8 |
© Bayerisches Landesamt für Umwelt 2024