
- Start >
- Rivers >
- Discharge >
- Bayern >
- Viechtach Reibenmühle >
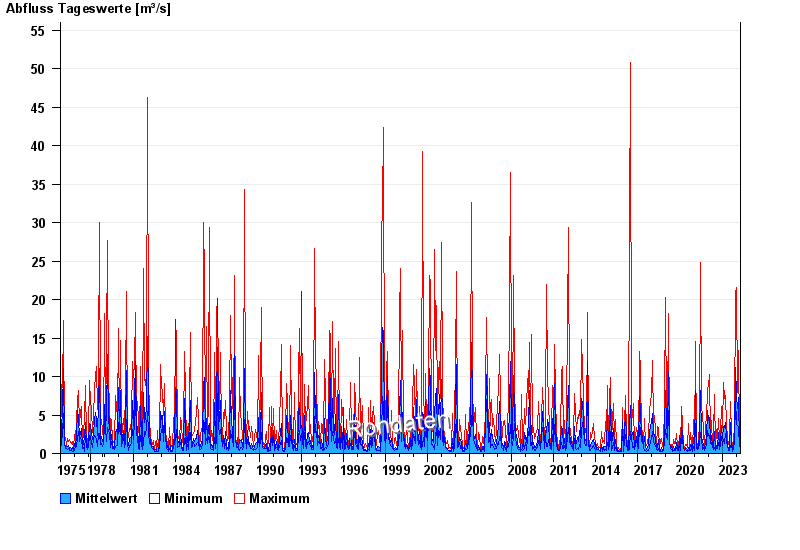
- Chart of total period

Chart of total period Viechtach Reibenmühle / Aitnach
Discharge from 01.11.1975 to 24.04.2024
| Date | Mean value [m³/s] | Maximum [m³/s] | Minimum [m³/s] |
|---|---|---|---|
| 24.04.2024 | 0.882 | 0.934 | 0.731 |
| 23.04.2024 | 1.01 | 1.08 | 0.934 |
| 22.04.2024 | 1.3 | 1.67 | 1.08 |
| 21.04.2024 | 1.68 | 2.05 | 1.41 |
| 20.04.2024 | 2.82 | 4.39 | 2.05 |
| 19.04.2024 | 1.78 | 5.75 | 0.731 |
| 18.04.2024 | 0.861 | 0.934 | 0.795 |
© Bayerisches Landesamt für Umwelt 2024