
- Start >
- Rivers >
- Discharge >
- Bayern >
- Unterthingau >
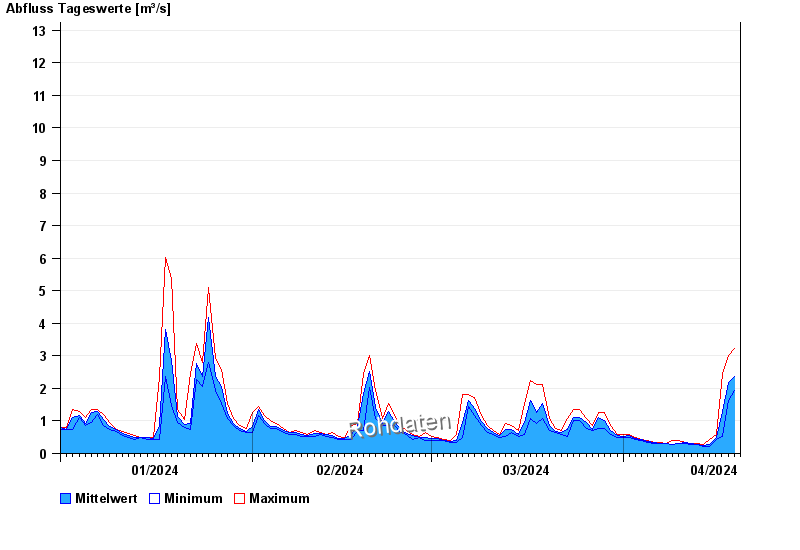
- Chart of year

Chart of year Unterthingau / Kirnach
Discharge from 01.01.2024 to 19.04.2024
- HQ2 21 m³/s
- HQ5 29 m³/s
- HQ10 35 m³/s
- HQ20 41 m³/s
- HQ50 48 m³/s
- HQ100 54 m³/s
| Date | Mean value [m³/s] | Maximum [m³/s] | Minimum [m³/s] |
|---|---|---|---|
| 19.04.2024 | 2.26 | 2.89 | 1.92 |
| 18.04.2024 | 2.18 | 3 | 1.62 |
| 17.04.2024 | 1.28 | 2.45 | 0.535 |
| 16.04.2024 | 0.496 | 0.593 | 0.432 |
| 15.04.2024 | 0.275 | 0.432 | 0.228 |
| 14.04.2024 | 0.234 | 0.262 | 0.228 |
| 13.04.2024 | 0.27 | 0.299 | 0.262 |
© Bayerisches Landesamt für Umwelt 2024