

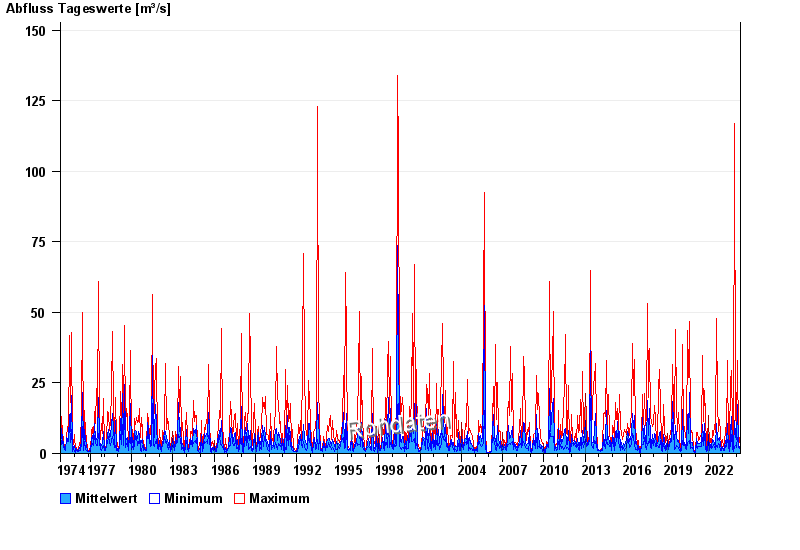
Chart of total period Unternogg / Halbammer
Discharge from 01.11.1974 to 19.04.2024
| Date | Mean value [m³/s] | Maximum [m³/s] | Minimum [m³/s] |
|---|---|---|---|
| 19.04.2024 | 1.16 | 1.18 | 1.11 |
| 18.04.2024 | 1.08 | 1.18 | 0.841 |
| 17.04.2024 | 1.06 | 1.26 | 0.902 |
| 16.04.2024 | 1.06 | 1.26 | 0.965 |
| 15.04.2024 | 0.916 | 1.18 | 0.53 |
| 14.04.2024 | 0.698 | 0.729 | 0.627 |
| 13.04.2024 | 0.699 | 0.729 | 0.627 |
© Bayerisches Landesamt für Umwelt 2024