

Chart of total period Türkheim / Wertach
Discharge from 01.11.1950 to 19.04.2024
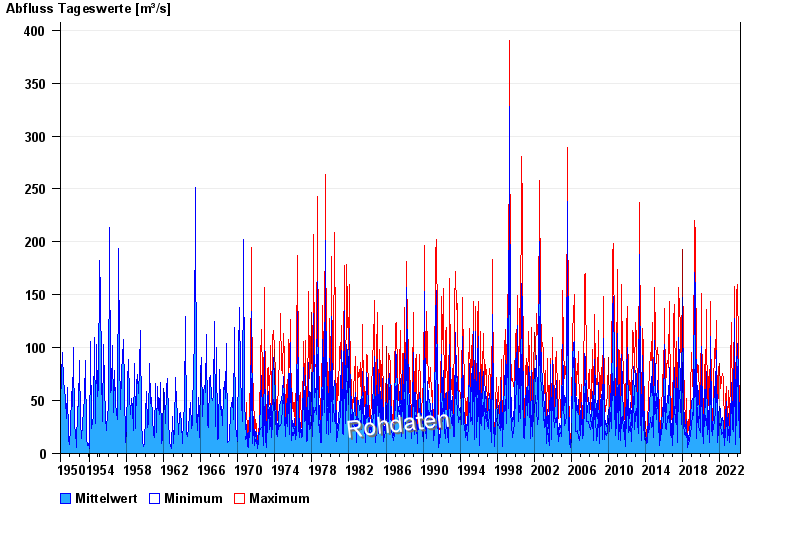
note
Beeinflussung durch Kraftwerksbetrieb
| Date | Mean value [m³/s] | Maximum [m³/s] | Minimum [m³/s] |
|---|---|---|---|
| 19.04.2024 | 14.6 | 15.2 | 14.1 |
| 18.04.2024 | 13 | 18.4 | 9.98 |
| 17.04.2024 | 8.04 | 17.2 | 4.34 |
| 16.04.2024 | 7 | 9.58 | 5.73 |
| 15.04.2024 | 7.16 | 10.8 | 4.88 |
| 14.04.2024 | 5.94 | 6.65 | 5.73 |
| 13.04.2024 | 6.1 | 7.67 | 5.14 |
© Bayerisches Landesamt für Umwelt 2024