

Chart of total period Trostberg / Alz
Discharge from 01.11.1950 to 20.04.2024
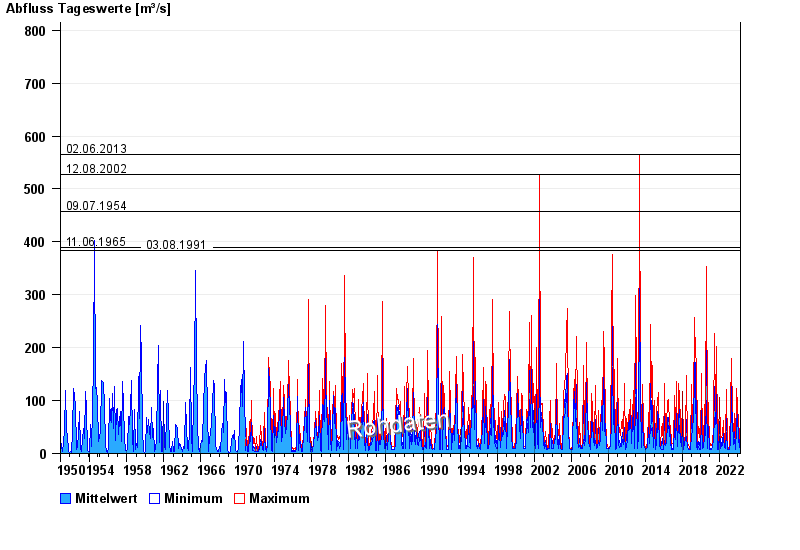
- 02.06.2013 Abfluss: 566 m³/s
- 12.08.2002 Abfluss: 528 m³/s
- 09.07.1954 Abfluss: 458 m³/s
- 11.06.1965 Abfluss: 389 m³/s
- 03.08.1991 Abfluss: 383 m³/s
| Date | Mean value [m³/s] | Maximum [m³/s] | Minimum [m³/s] |
|---|---|---|---|
| 20.04.2024 | 11.7 | 11.7 | 11.7 |
| 19.04.2024 | 11.8 | 12.1 | 11.7 |
| 18.04.2024 | 11.7 | 12.1 | 11.7 |
| 17.04.2024 | 11.8 | 12.1 | 11.7 |
| 16.04.2024 | 11.7 | 12.1 | 11.7 |
| 15.04.2024 | 11.8 | 12.1 | 11.2 |
| 14.04.2024 | 11.7 | 12.1 | 11.7 |
© Bayerisches Landesamt für Umwelt 2024