
- Start >
- Rivers >
- Discharge >
- Bayern >
- Treuchtlingen >
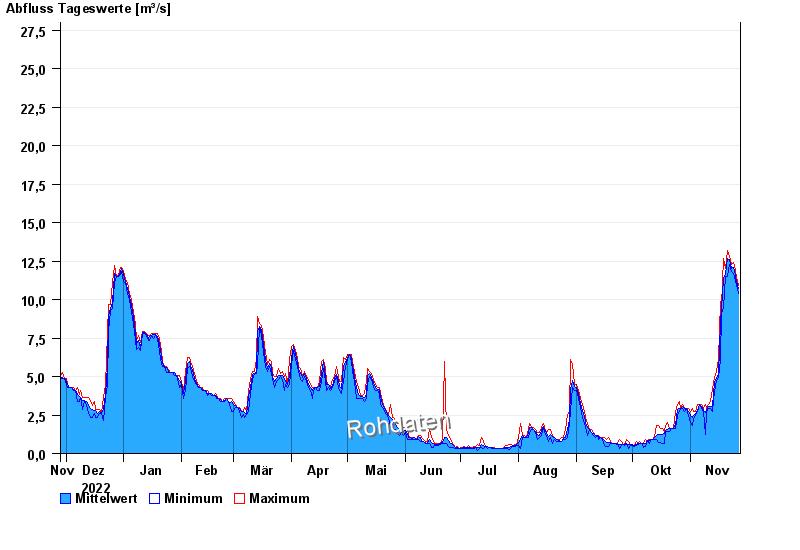
- Chart of year

Chart of year Treuchtlingen / Altmühl
Discharge from 28.11.2022 to 27.11.2023
- HQ1 45 m³/s
- HQ2 63 m³/s
- HQ5 85 m³/s
- HQ10 110 m³/s
- HQ20 135 m³/s
- HQ50 170 m³/s
- HQ100 200 m³/s
| Date | Mean value [m³/s] | Maximum [m³/s] | Minimum [m³/s] |
|---|---|---|---|
| 27.11.2023 | 10.7 | 10.9 | 10.4 |
| 26.11.2023 | 11.2 | 11.5 | 10.9 |
| 25.11.2023 | 11.9 | 12.2 | 11.5 |
| 24.11.2023 | 12.1 | 12.4 | 11.7 |
| 23.11.2023 | 12 | 12.3 | 11.8 |
| 22.11.2023 | 12.6 | 12.8 | 12.3 |
| 21.11.2023 | 12.7 | 13.2 | 11.5 |
© Bayerisches Landesamt für Umwelt 2024