
- Start >
- Rivers >
- Discharge >
- Bayern >
- Treuchtlingen >
- Chart of year

Chart of year Treuchtlingen / Altmühl
Discharge from 10.02.2023 to 09.02.2024
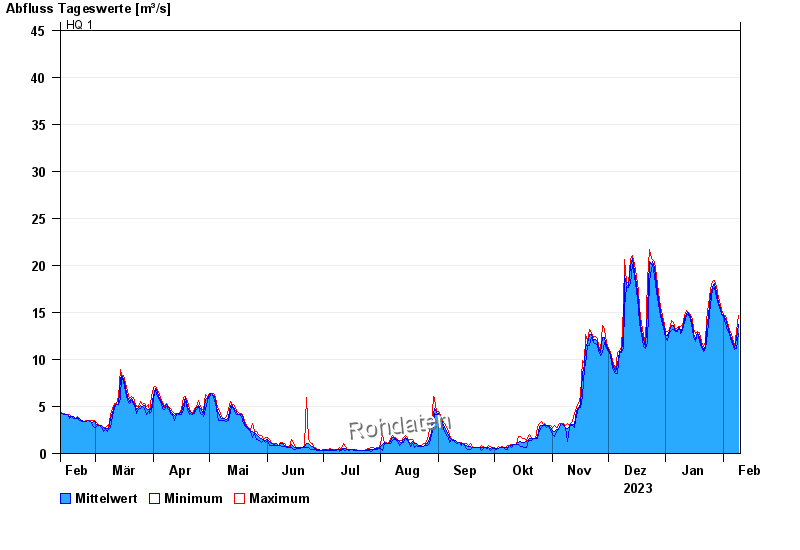
- HQ1 45 m³/s
- HQ2 63 m³/s
- HQ5 85 m³/s
- HQ10 110 m³/s
- HQ20 135 m³/s
- HQ50 170 m³/s
- HQ100 200 m³/s
| Date | Mean value [m³/s] | Maximum [m³/s] | Minimum [m³/s] |
|---|---|---|---|
| 09.02.2024 | 13.7 | 14.7 | 12.8 |
| 08.02.2024 | 12.2 | 13 | 11.2 |
| 07.02.2024 | 11.2 | 11.4 | 11.1 |
| 06.02.2024 | 11.6 | 11.9 | 11.4 |
| 05.02.2024 | 12.2 | 12.6 | 11.9 |
| 04.02.2024 | 12.9 | 13.1 | 12.6 |
| 03.02.2024 | 13.6 | 13.9 | 13.1 |
© Bayerisches Landesamt für Umwelt 2024