
- Start >
- Rivers >
- Discharge >
- Bayern >
- Treuchtlingen >
- Chart of total period

Chart of total period Treuchtlingen / Altmühl
Discharge from 01.11.1929 to 24.04.2024
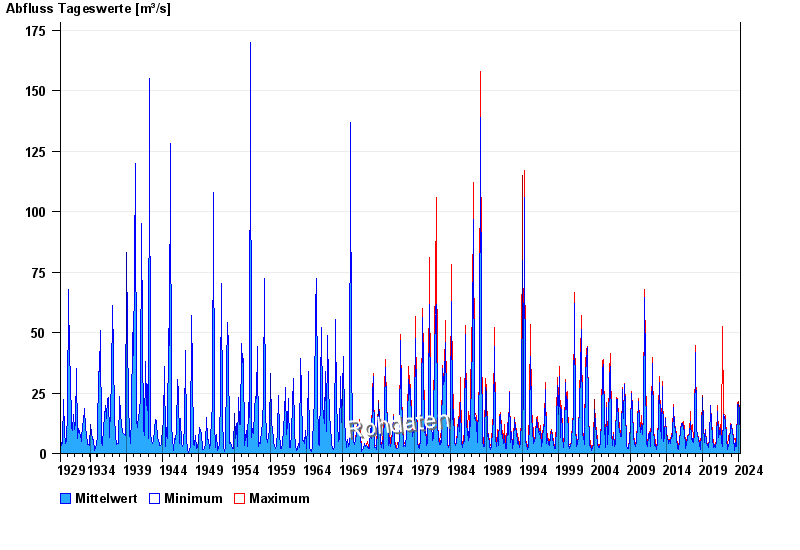
| Date | Mean value [m³/s] | Maximum [m³/s] | Minimum [m³/s] |
|---|---|---|---|
| 24.04.2024 | 4.34 | 4.4 | 4.21 |
| 23.04.2024 | 4.21 | 4.21 | 4.21 |
| 22.04.2024 | 4.15 | 4.21 | 4.01 |
| 21.04.2024 | 3.96 | 4.01 | 3.81 |
| 20.04.2024 | 3.87 | 4.01 | 3.81 |
| 19.04.2024 | 3.68 | 4.01 | 3.39 |
| 18.04.2024 | 3.46 | 3.81 | 2.94 |
© Bayerisches Landesamt für Umwelt 2024