
- Start >
- Rivers >
- Discharge >
- Bayern >
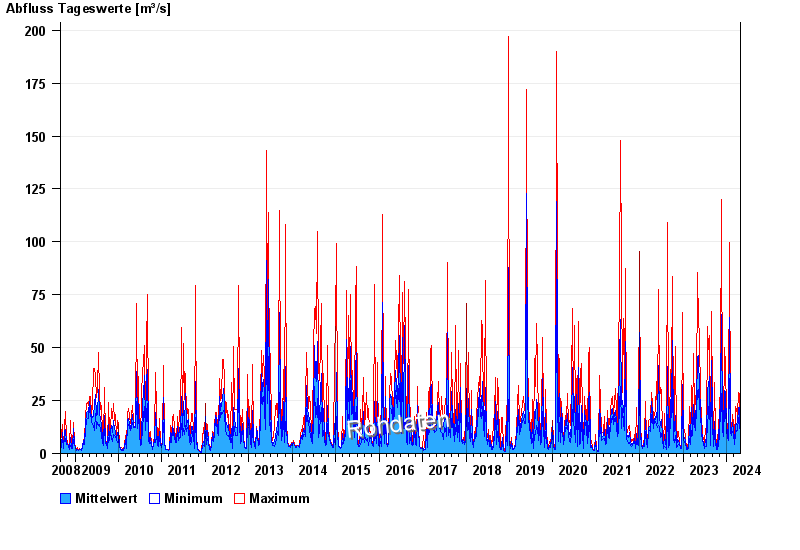
- Tiefenbach >
- Chart of total period

Chart of total period Tiefenbach / Breitach
Discharge from 01.09.2008 to 24.04.2024
| Date | Mean value [m³/s] | Maximum [m³/s] | Minimum [m³/s] |
|---|---|---|---|
| 24.04.2024 | 4.72 | 5.06 | 4.47 |
| 23.04.2024 | 5.17 | 5.69 | 4.76 |
| 22.04.2024 | 5.89 | 6.33 | 5.69 |
| 21.04.2024 | 6.68 | 7 | 6.33 |
| 20.04.2024 | 7.6 | 8.41 | 7 |
| 19.04.2024 | 7.81 | 8.41 | 7.34 |
| 18.04.2024 | 8.83 | 9.54 | 8.41 |
© Bayerisches Landesamt für Umwelt 2024