

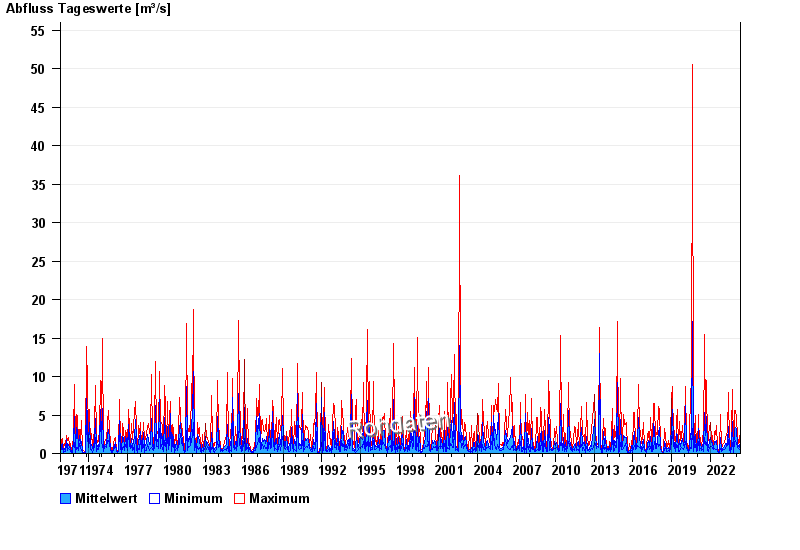
Chart of total period Thundorf / Kleine Sur
Discharge from 01.11.1971 to 19.04.2024
| Date | Mean value [m³/s] | Maximum [m³/s] | Minimum [m³/s] |
|---|---|---|---|
| 19.04.2024 | 0.241 | 0.241 | 0.241 |
| 18.04.2024 | 0.259 | 0.298 | 0.241 |
| 17.04.2024 | 0.261 | 0.365 | 0.19 |
| 16.04.2024 | 0.207 | 0.214 | 0.19 |
| 15.04.2024 | 0.215 | 0.298 | 0.19 |
| 14.04.2024 | 0.195 | 0.214 | 0.19 |
| 13.04.2024 | 0.192 | 0.214 | 0.19 |
© Bayerisches Landesamt für Umwelt 2024