
- Start >
- Rivers >
- Discharge >
- Bayern >
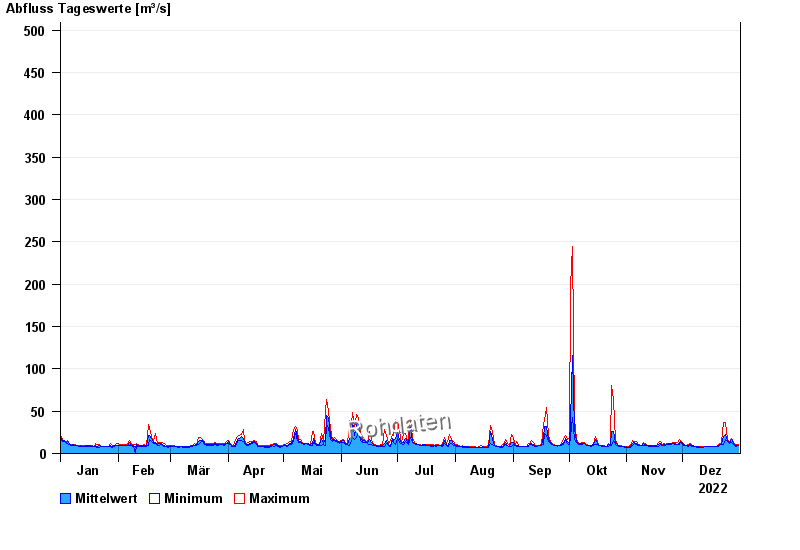
- Sylvensteinsee Gesamtzufluss >
- Chart of year

Chart of year Sylvensteinsee Gesamtzufluss / Sylvensteinsee
Discharge from 01.01.2022 to 31.12.2022
 Für diesen Pegel sind keine Jährlichkeiten hinterlegt.
| Date | Mean value [m³/s] | Maximum [m³/s] | Minimum [m³/s] |
|---|---|---|---|
| 31.12.2022 | 9.46 | 10.1 | 9 |
| 30.12.2022 | 9.32 | 10.7 | 8.6 |
| 29.12.2022 | 10.2 | 10.9 | 9.7 |
| 28.12.2022 | 12.2 | 14.5 | 10.8 |
| 27.12.2022 | 16 | 18 | 13.4 |
| 26.12.2022 | 12.9 | 14.3 | 11.5 |
| 25.12.2022 | 15.7 | 17.1 | 14.2 |
© Bayerisches Landesamt für Umwelt 2024