

Chart of year Stöckach / Zenn
Discharge from 01.01.2023 to 31.12.2023
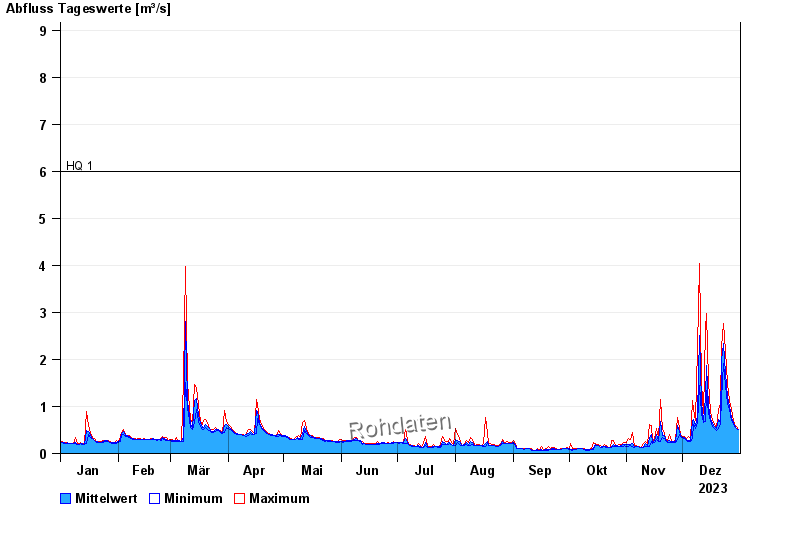
- HQ1 6 m³/s
- HQ2 11 m³/s
- HQ5 16 m³/s
- HQ10 22 m³/s
- HQ20 30 m³/s
- HQ50 43 m³/s
- HQ100 57 m³/s
| Date | Mean value [m³/s] | Maximum [m³/s] | Minimum [m³/s] |
|---|---|---|---|
| 31.12.2023 | 0.51 | 0.51 | 0.51 |
| 30.12.2023 | 0.54 | 0.578 | 0.532 |
| 29.12.2023 | 0.588 | 0.625 | 0.578 |
| 28.12.2023 | 0.661 | 0.698 | 0.625 |
| 27.12.2023 | 0.765 | 0.93 | 0.698 |
| 26.12.2023 | 0.993 | 1.12 | 0.93 |
| 25.12.2023 | 1.22 | 1.48 | 1.06 |
© Bayerisches Landesamt für Umwelt 2024