

Chart of year Stöckach / Zenn
Discharge from 01.01.2022 to 31.12.2022
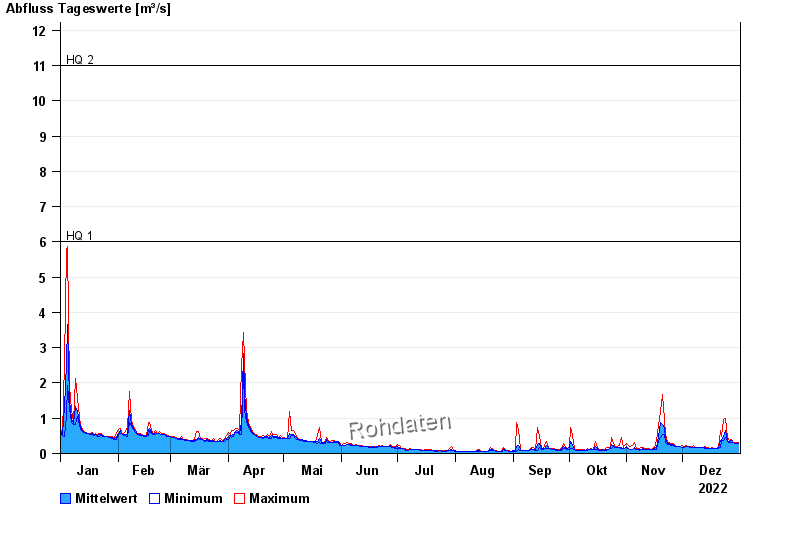
- HQ1 6 m³/s
- HQ2 11 m³/s
- HQ5 16 m³/s
- HQ10 22 m³/s
- HQ20 30 m³/s
- HQ50 43 m³/s
- HQ100 57 m³/s
| Date | Mean value [m³/s] | Maximum [m³/s] | Minimum [m³/s] |
|---|---|---|---|
| 31.12.2022 | 0.284 | 0.298 | 0.279 |
| 30.12.2022 | 0.286 | 0.298 | 0.279 |
| 29.12.2022 | 0.287 | 0.298 | 0.279 |
| 28.12.2022 | 0.302 | 0.318 | 0.298 |
| 27.12.2022 | 0.356 | 0.4 | 0.318 |
| 26.12.2022 | 0.332 | 0.359 | 0.318 |
| 25.12.2022 | 0.382 | 0.463 | 0.339 |
© Bayerisches Landesamt für Umwelt 2024