

Chart of year Stöckach / Zenn
Discharge from 01.01.2018 to 31.12.2018
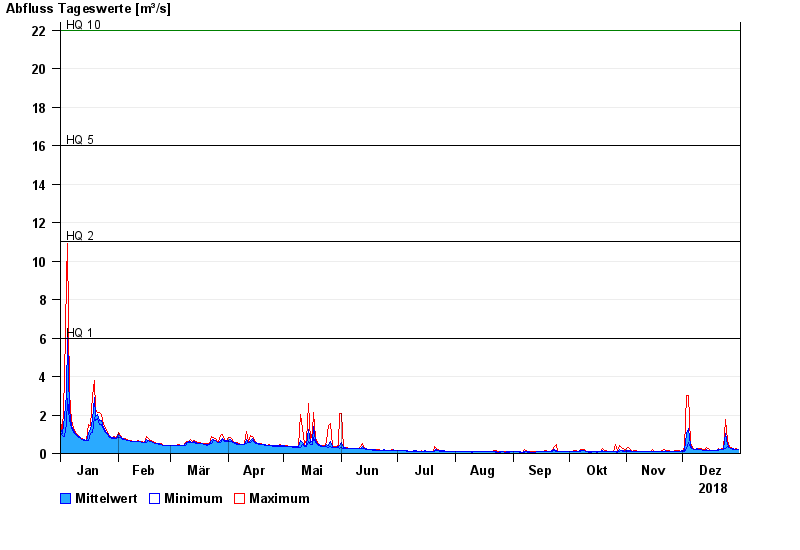
- HQ1 6 m³/s
- HQ2 11 m³/s
- HQ5 16 m³/s
- HQ10 22 m³/s
- HQ20 30 m³/s
- HQ50 43 m³/s
- HQ100 57 m³/s
| Date | Mean value [m³/s] | Maximum [m³/s] | Minimum [m³/s] |
|---|---|---|---|
| 31.12.2018 | 0.215 | 0.224 | 0.213 |
| 30.12.2018 | 0.231 | 0.24 | 0.222 |
| 29.12.2018 | 0.223 | 0.231 | 0.217 |
| 28.12.2018 | 0.248 | 0.269 | 0.231 |
| 27.12.2018 | 0.282 | 0.299 | 0.269 |
| 26.12.2018 | 0.328 | 0.381 | 0.289 |
| 25.12.2018 | 0.482 | 0.654 | 0.381 |
© Bayerisches Landesamt für Umwelt 2024