

Chart of total period Schönberg / Große Ohe
Discharge from 01.11.1953 to 19.04.2024
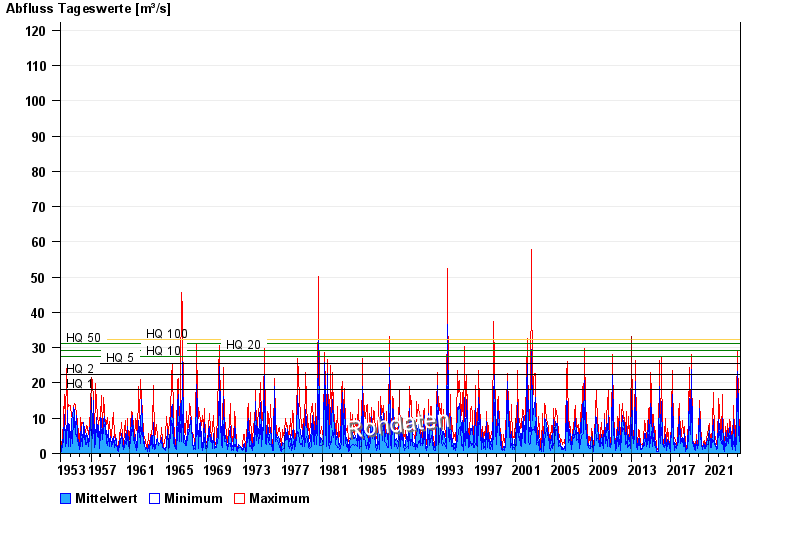
- HQ1 18,2 m³/s
- HQ2 22,3 m³/s
- HQ5 25,6 m³/s
- HQ10 27,6 m³/s
- HQ20 29,2 m³/s
- HQ50 31,1 m³/s
- HQ100 32,3 m³/s
| Date | Mean value [m³/s] | Maximum [m³/s] | Minimum [m³/s] |
|---|---|---|---|
| 19.04.2024 | 1.85 | 2.11 | 0.888 |
| 18.04.2024 | 1.93 | 2.11 | 1.72 |
| 17.04.2024 | 1.53 | 1.95 | 1.31 |
| 16.04.2024 | 1.48 | 1.72 | 1.31 |
| 15.04.2024 | 1.18 | 1.72 | 0.945 |
| 14.04.2024 | 0.975 | 1.79 | 0.411 |
| 13.04.2024 | 1.07 | 1.25 | 1 |
© Bayerisches Landesamt für Umwelt 2024