

Chart of year Schmerold / Mangfall
Discharge from 01.01.2022 to 31.12.2022
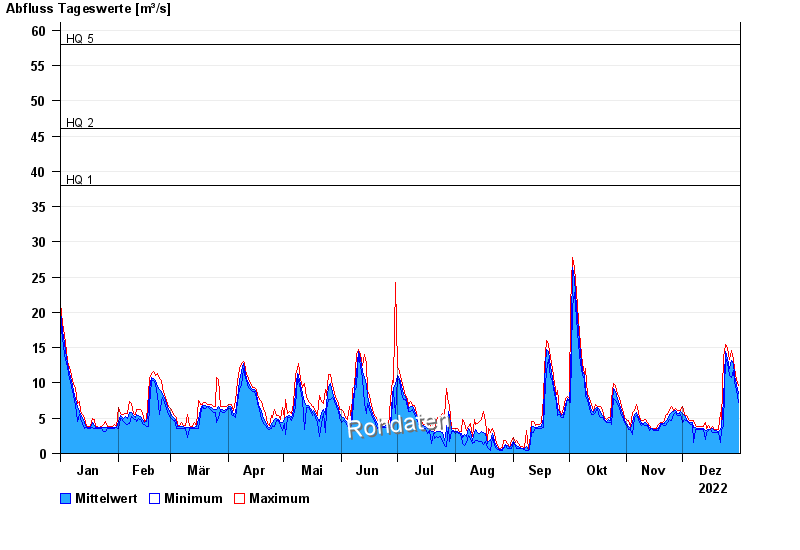
- HQ1 38 m³/s
- HQ2 46 m³/s
- HQ5 58 m³/s
- HQ10 70 m³/s
- HQ20 84 m³/s
- HQ50 100 m³/s
- HQ100 120 m³/s
| Date | Mean value [m³/s] | Maximum [m³/s] | Minimum [m³/s] |
|---|---|---|---|
| 31.12.2022 | 8.53 | 9.59 | 7.24 |
| 30.12.2022 | 9.78 | 10.5 | 9 |
| 29.12.2022 | 11 | 12.1 | 10.2 |
| 28.12.2022 | 12.7 | 13.3 | 11.8 |
| 27.12.2022 | 13.2 | 14.6 | 10.8 |
| 26.12.2022 | 12 | 13.3 | 11.1 |
| 25.12.2022 | 13.4 | 14.9 | 12.7 |
© Bayerisches Landesamt für Umwelt 2024