
- Start >
- Rivers >
- Discharge >
- Bayern >
- Schlehenmühle >
- Chart of total period

Chart of total period Schlehenmühle / Roter Main
Discharge from 01.11.1956 to 18.04.2024
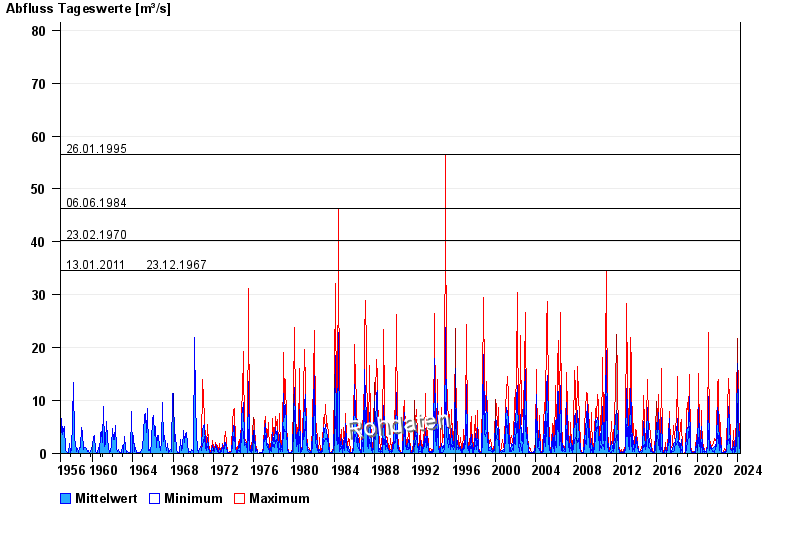
- 26.01.1995 Abfluss: 56,6 m³/s
- 06.06.1984 Abfluss: 46,3 m³/s
- 23.02.1970 Abfluss: 40,3 m³/s
- 13.01.2011 Abfluss: 34,6 m³/s
- 23.12.1967 Abfluss: 34,5 m³/s
| Date | Mean value [m³/s] | Maximum [m³/s] | Minimum [m³/s] |
|---|---|---|---|
| 18.04.2024 | 0.298 | 0.333 | 0.263 |
| 17.04.2024 | 0.353 | 0.457 | 0.263 |
| 16.04.2024 | 0.224 | 0.296 | 0.203 |
| 15.04.2024 | 0.217 | 0.263 | 0.176 |
| 14.04.2024 | 0.207 | 0.232 | 0.203 |
| 13.04.2024 | 0.232 | 0.232 | 0.232 |
| 12.04.2024 | 0.232 | 0.232 | 0.232 |
© Bayerisches Landesamt für Umwelt 2024