
- Start >
- Rivers >
- Discharge >
- Bayern >
- Rottersdorf >
- Chart of total period

Chart of total period Rottersdorf / Vils
Discharge from 01.11.1939 to 19.04.2024
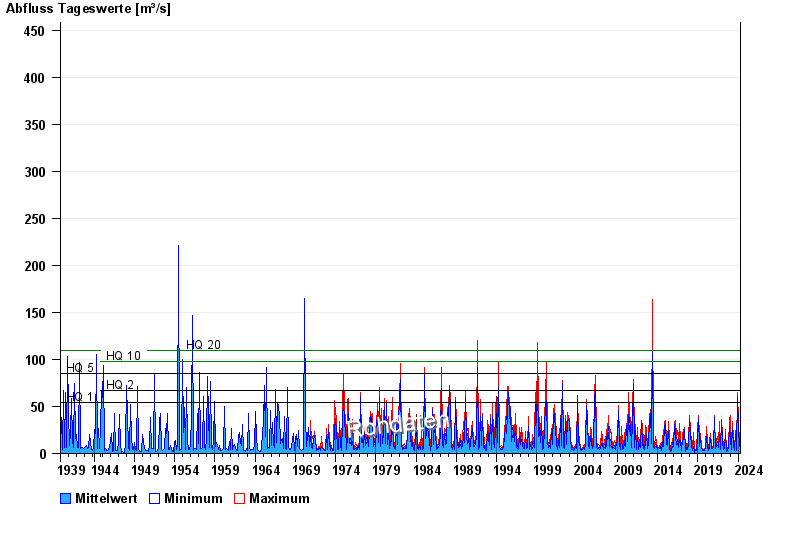
- HQ1 54 m³/s
- HQ2 67 m³/s
- HQ5 85 m³/s
- HQ10 98 m³/s
- HQ20 110 m³/s
| Date | Mean value [m³/s] | Maximum [m³/s] | Minimum [m³/s] |
|---|---|---|---|
| 19.04.2024 | 4.01 | 4.25 | 3.88 |
| 18.04.2024 | 3.93 | 4.25 | 3.54 |
| 17.04.2024 | 4.12 | 4.87 | 3.71 |
| 16.04.2024 | 3.98 | 4.65 | 3.54 |
| 15.04.2024 | 3.22 | 3.88 | 2.7 |
| 14.04.2024 | 2.95 | 3.23 | 2.57 |
| 13.04.2024 | 3.07 | 3.38 | 2.96 |
© Bayerisches Landesamt für Umwelt 2024