

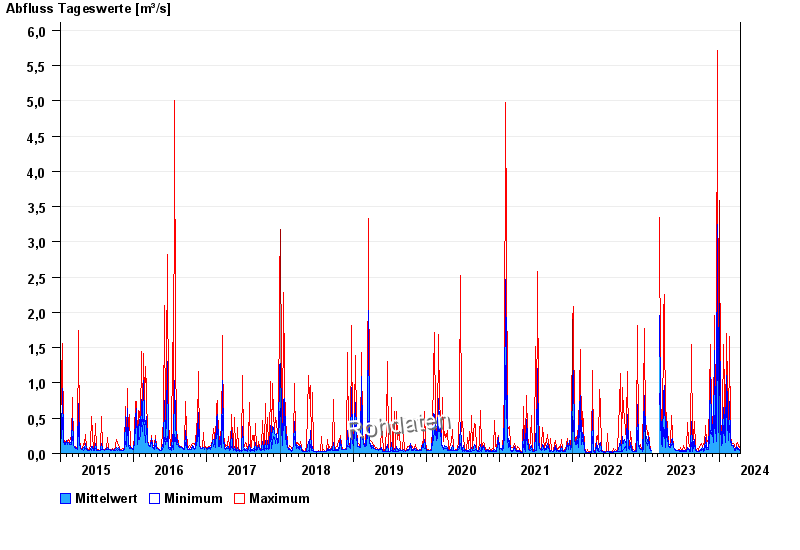
Chart of total period Raigering / Krumbach
Discharge from 01.01.2015 to 16.04.2024
 Für diesen Pegel sind keine Hauptwerte hinterlegt.
| Date | Mean value [m³/s] | Maximum [m³/s] | Minimum [m³/s] |
|---|---|---|---|
| 16.04.2024 | 0.054 | 0.071 | 0.051 |
| 15.04.2024 | 0.056 | 0.078 | 0.04 |
| 14.04.2024 | 0.039 | 0.045 | 0.035 |
| 13.04.2024 | 0.043 | 0.063 | 0.04 |
| 12.04.2024 | 0.046 | 0.063 | 0.04 |
| 11.04.2024 | 0.049 | 0.051 | 0.045 |
| 10.04.2024 | 0.058 | 0.086 | 0.045 |
© Bayerisches Landesamt für Umwelt 2024