

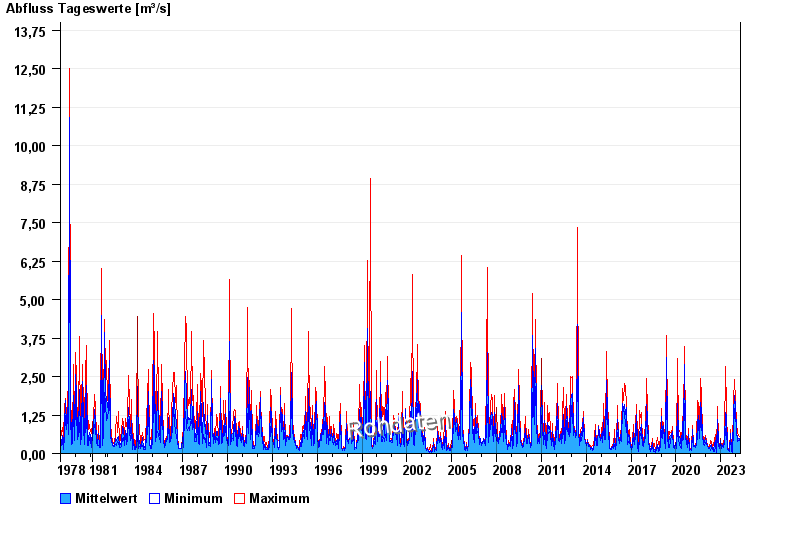
Chart of total period Percha / Lüßbach
Discharge from 01.11.1978 to 25.04.2024
| Date | Mean value [m³/s] | Maximum [m³/s] | Minimum [m³/s] |
|---|---|---|---|
| 25.04.2024 | 0.353 | 0.362 | 0.325 |
| 24.04.2024 | 0.357 | 0.4 | 0.325 |
| 23.04.2024 | 0.359 | 0.4 | 0.325 |
| 22.04.2024 | 0.393 | 0.44 | 0.325 |
| 21.04.2024 | 0.364 | 0.44 | 0.289 |
| 20.04.2024 | 0.355 | 0.48 | 0.325 |
| 19.04.2024 | 0.324 | 0.362 | 0.289 |
© Bayerisches Landesamt für Umwelt 2024