
- Start >
- Rivers >
- Discharge >
- Bayern >
- Peißenberg >
- Chart of year

Chart of year Peißenberg / Ammer
Discharge from 01.01.2024 to 25.04.2024
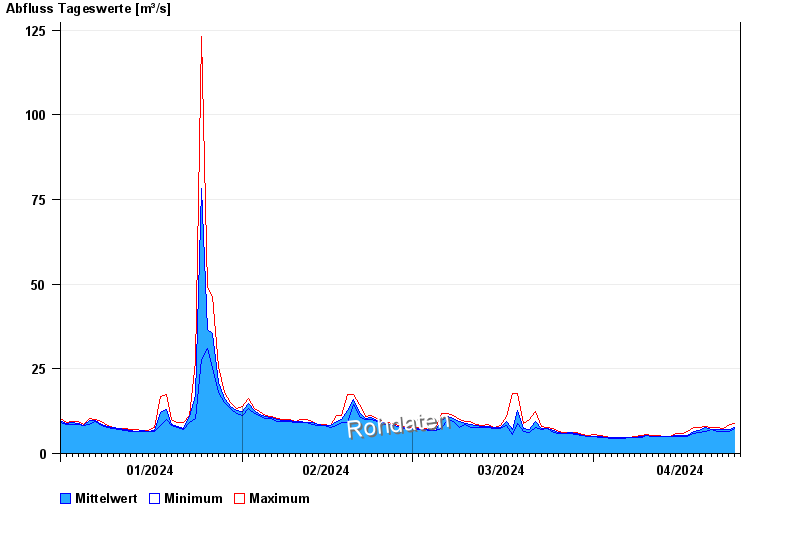
| Date | Mean value [m³/s] | Maximum [m³/s] | Minimum [m³/s] |
|---|---|---|---|
| 25.04.2024 | 8.14 | 8.98 | 7.31 |
| 24.04.2024 | 7.01 | 8.54 | 6.55 |
| 23.04.2024 | 6.94 | 7.31 | 6.55 |
| 22.04.2024 | 7 | 7.72 | 6.55 |
| 21.04.2024 | 7.14 | 7.72 | 6.94 |
| 20.04.2024 | 7.77 | 8.11 | 6.55 |
| 19.04.2024 | 6.75 | 7.72 | 6.2 |
© Bayerisches Landesamt für Umwelt 2024