

Chart of year Obernach / Ach
Discharge from 22.01.2022 to 21.01.2023
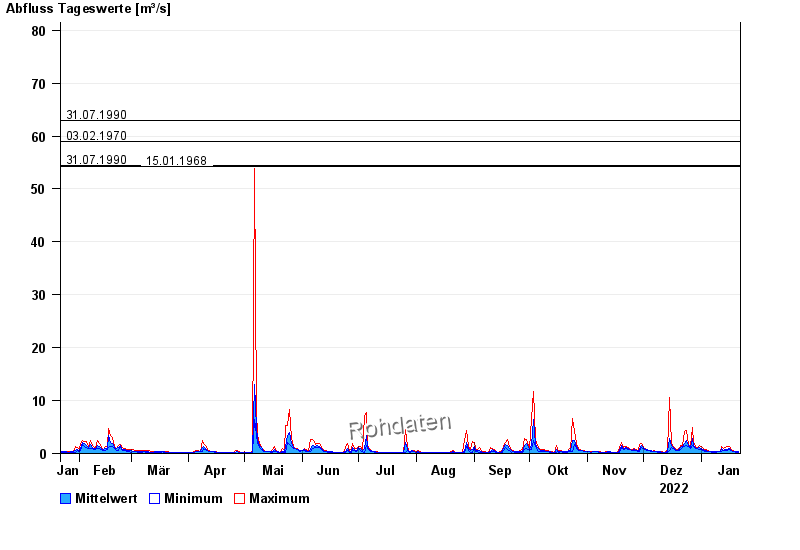
- 22.05.1999 Abfluss: 85,5 m³/s
- 31.07.1990 Abfluss: 62,9 m³/s
- 03.02.1970 Abfluss: 59 m³/s
- 31.07.1990 Abfluss: 54,4 m³/s
- 15.01.1968 Abfluss: 54,3 m³/s
| Date | Mean value [m³/s] | Maximum [m³/s] | Minimum [m³/s] |
|---|---|---|---|
| 21.01.2023 | 0.298 | 0.382 | 0.248 |
| 20.01.2023 | 0.32 | 0.382 | 0.276 |
| 19.01.2023 | 0.383 | 0.469 | 0.343 |
| 18.01.2023 | 0.465 | 0.571 | 0.382 |
| 17.01.2023 | 0.616 | 0.793 | 0.519 |
| 16.01.2023 | 0.896 | 1.3 | 0.679 |
| 15.01.2023 | 0.775 | 1.3 | 0.571 |
© Bayerisches Landesamt für Umwelt 2024