

Chart of year Obernach / Ach
Discharge from 25.01.2022 to 24.01.2023
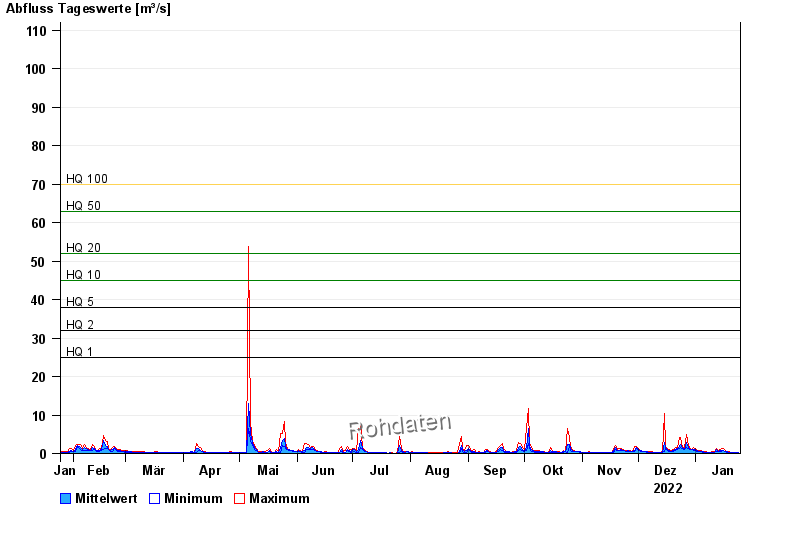
- HQ1 25 m³/s
- HQ2 32 m³/s
- HQ5 38 m³/s
- HQ10 45 m³/s
- HQ20 52 m³/s
- HQ50 63 m³/s
- HQ100 70 m³/s
| Date | Mean value [m³/s] | Maximum [m³/s] | Minimum [m³/s] |
|---|---|---|---|
| 24.01.2023 | 0.263 | 0.343 | 0.248 |
| 23.01.2023 | 0.265 | 0.343 | 0.198 |
| 22.01.2023 | 0.299 | 0.382 | 0.248 |
| 21.01.2023 | 0.298 | 0.382 | 0.248 |
| 20.01.2023 | 0.32 | 0.382 | 0.276 |
| 19.01.2023 | 0.383 | 0.469 | 0.343 |
| 18.01.2023 | 0.465 | 0.571 | 0.382 |
© Bayerisches Landesamt für Umwelt 2024