

Chart of year Obernach / Ach
Discharge from 01.01.2024 to 24.04.2024
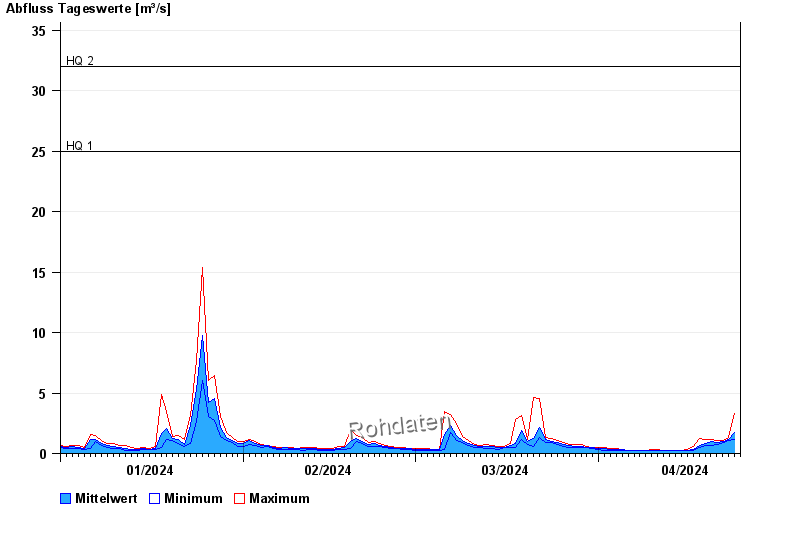
- HQ1 25 m³/s
- HQ2 32 m³/s
- HQ5 38 m³/s
- HQ10 45 m³/s
- HQ20 52 m³/s
- HQ50 63 m³/s
- HQ100 70 m³/s
| Date | Mean value [m³/s] | Maximum [m³/s] | Minimum [m³/s] |
|---|---|---|---|
| 24.04.2024 | 1.25 | 1.32 | 1.18 |
| 23.04.2024 | 1.16 | 1.32 | 1.04 |
| 22.04.2024 | 0.993 | 1.11 | 0.903 |
| 21.04.2024 | 0.932 | 1.11 | 0.779 |
| 20.04.2024 | 1.01 | 1.18 | 0.665 |
| 19.04.2024 | 0.852 | 1.18 | 0.665 |
| 18.04.2024 | 0.683 | 1.25 | 0.468 |
© Bayerisches Landesamt für Umwelt 2024