
- Start >
- Rivers >
- Discharge >
- Bayern >
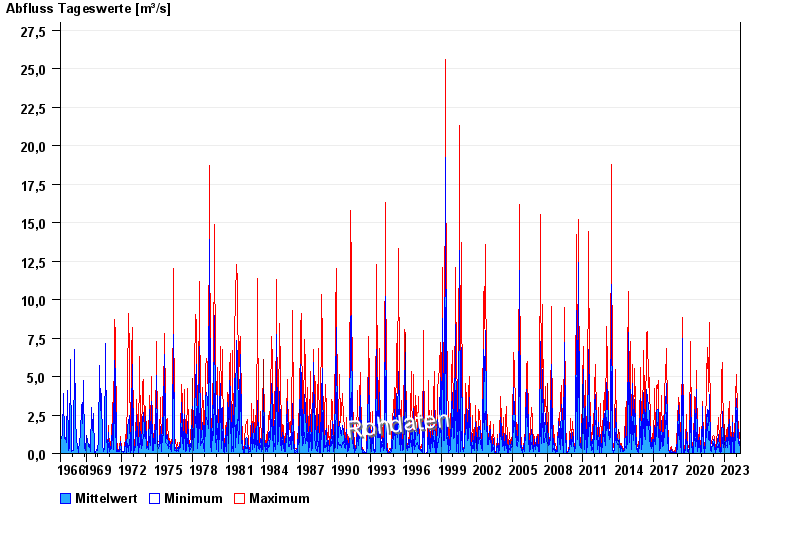
- Obermühlhausen >
- Chart of total period

Chart of total period Obermühlhausen / Windach
Discharge from 01.11.1966 to 25.04.2024
| Date | Mean value [m³/s] | Maximum [m³/s] | Minimum [m³/s] |
|---|---|---|---|
| 25.04.2024 | 0.185 | 0.211 | 0.15 |
| 24.04.2024 | 0.26 | 0.358 | 0.179 |
| 23.04.2024 | 0.357 | 0.4 | 0.318 |
| 22.04.2024 | 0.474 | 0.533 | 0.4 |
| 21.04.2024 | 0.358 | 0.487 | 0.281 |
| 20.04.2024 | 0.429 | 0.629 | 0.211 |
| 19.04.2024 | 0.207 | 0.281 | 0.179 |
© Bayerisches Landesamt für Umwelt 2024