
- Start >
- Rivers >
- Discharge >
- Bayern >
- Obermühlhausen >
- Chart of total period

Chart of total period Obermühlhausen / Windach
Discharge from 01.11.1966 to 23.04.2024
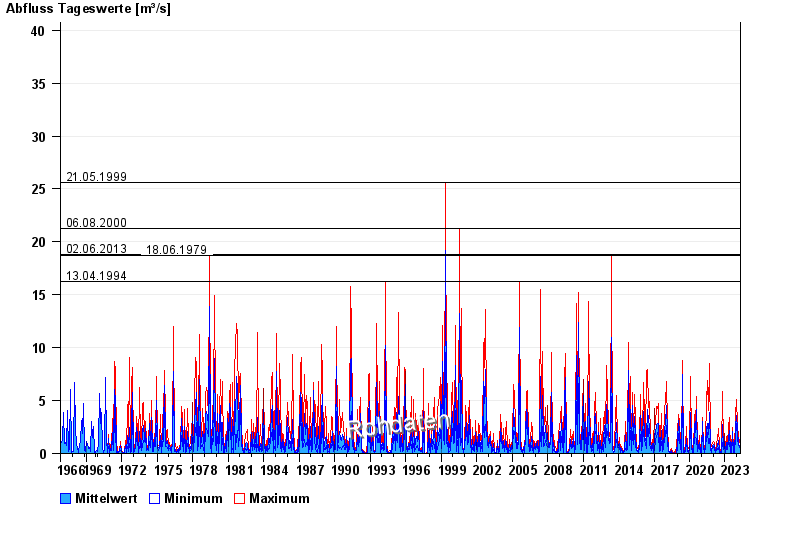
- 21.05.1999 Abfluss: 25,6 m³/s
- 06.08.2000 Abfluss: 21,3 m³/s
- 02.06.2013 Abfluss: 18,8 m³/s
- 18.06.1979 Abfluss: 18,7 m³/s
- 13.04.1994 Abfluss: 16,3 m³/s
| Date | Mean value [m³/s] | Maximum [m³/s] | Minimum [m³/s] |
|---|---|---|---|
| 23.04.2024 | 0.328 | 0.4 | 0.318 |
| 22.04.2024 | 0.474 | 0.533 | 0.4 |
| 21.04.2024 | 0.358 | 0.487 | 0.281 |
| 20.04.2024 | 0.429 | 0.629 | 0.211 |
| 19.04.2024 | 0.207 | 0.281 | 0.179 |
| 18.04.2024 | 0.143 | 0.244 | 0.079 |
| 17.04.2024 | 0.067 | 0.123 | 0.033 |
© Bayerisches Landesamt für Umwelt 2024