
- Start >
- Rivers >
- Discharge >
- Bayern >
- Oberaudorf >
- Chart of total period

Chart of total period Oberaudorf / Inn
Discharge from 01.11.1900 to 23.04.2024
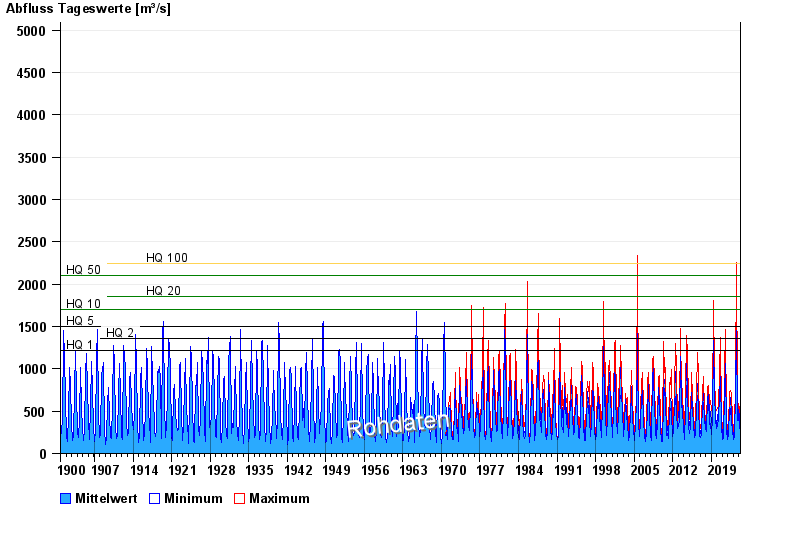
- HQ1 1220 m³/s
- HQ2 1360 m³/s
- HQ5 1500 m³/s
- HQ10 1700 m³/s
- HQ20 1850 m³/s
- HQ50 2100 m³/s
- HQ100 2250 m³/s
| Date | Mean value [m³/s] | Maximum [m³/s] | Minimum [m³/s] |
|---|---|---|---|
| 23.04.2024 | 281 | 314 | 262 |
| 22.04.2024 | 274 | 297 | 246 |
| 21.04.2024 | 274 | 316 | 246 |
| 20.04.2024 | 313 | 344 | 287 |
| 19.04.2024 | 344 | 413 | 299 |
| 18.04.2024 | 434 | 474 | 375 |
| 17.04.2024 | 494 | 561 | 444 |
© Bayerisches Landesamt für Umwelt 2024