

Chart of total period Mühltal / Glonn
Discharge from 01.11.1958 to 20.04.2024
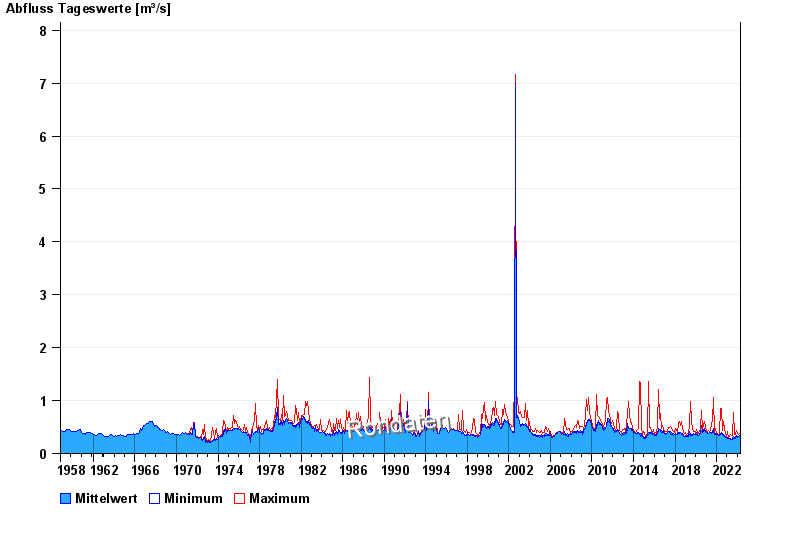
| Date | Mean value [m³/s] | Maximum [m³/s] | Minimum [m³/s] |
|---|---|---|---|
| 20.04.2024 | 0.333 | 0.351 | 0.332 |
| 19.04.2024 | 0.335 | 0.351 | 0.332 |
| 18.04.2024 | 0.332 | 0.351 | 0.332 |
| 17.04.2024 | 0.337 | 0.351 | 0.332 |
| 16.04.2024 | 0.332 | 0.351 | 0.332 |
| 15.04.2024 | 0.335 | 0.372 | 0.332 |
| 14.04.2024 | 0.332 | 0.332 | 0.332 |
© Bayerisches Landesamt für Umwelt 2024