
- Start >
- Rivers >
- Discharge >
- Bayern >
- Marktredwitz >
- Chart of year

Chart of year Marktredwitz / Kössein
Discharge from 01.01.2024 to 25.04.2024
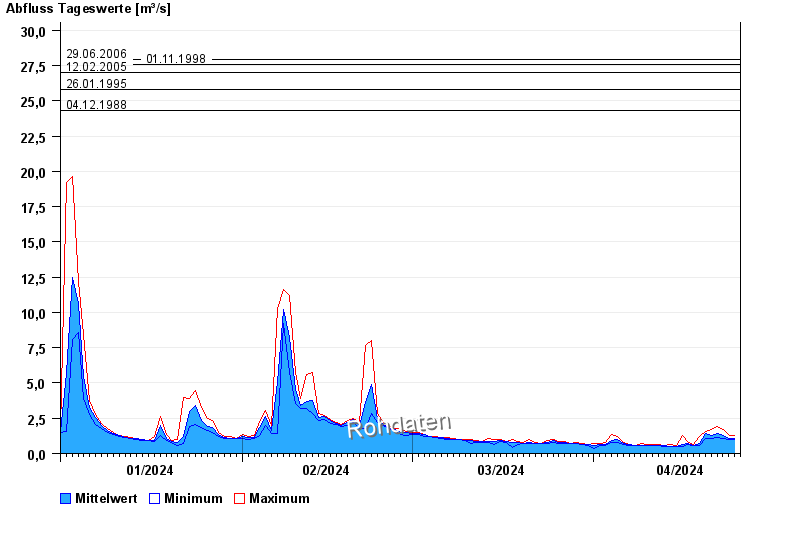
- 29.06.2006 Abfluss: 27,9 m³/s
- 01.11.1998 Abfluss: 27,6 m³/s
- 12.02.2005 Abfluss: 27 m³/s
- 26.01.1995 Abfluss: 25,8 m³/s
- 04.12.1988 Abfluss: 24,3 m³/s
| Date | Mean value [m³/s] | Maximum [m³/s] | Minimum [m³/s] |
|---|---|---|---|
| 25.04.2024 | 1.06 | 1.12 | 1.01 |
| 24.04.2024 | 1.1 | 1.3 | 1.01 |
| 23.04.2024 | 1.32 | 1.76 | 1.12 |
| 22.04.2024 | 1.44 | 1.97 | 1.18 |
| 21.04.2024 | 1.32 | 1.76 | 1.07 |
| 20.04.2024 | 1.43 | 1.62 | 1.12 |
| 19.04.2024 | 0.75 | 1.24 | 0.59 |
© Bayerisches Landesamt für Umwelt 2024