

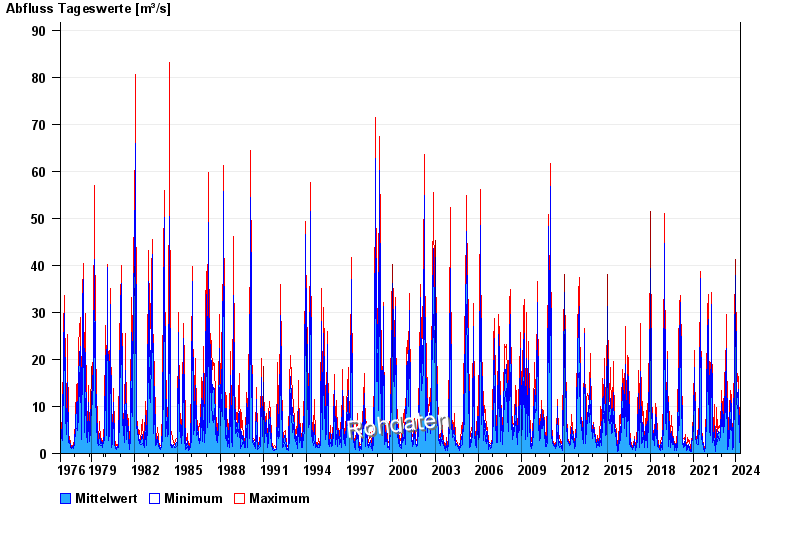
Chart of total period Lierheim / Eger
Discharge from 01.11.1976 to 25.04.2024
note
Abflussermittlung beeinflusst!
| Date | Mean value [m³/s] | Maximum [m³/s] | Minimum [m³/s] |
|---|---|---|---|
| 25.04.2024 | 2.27 | 2.27 | 2.27 |
| 24.04.2024 | 2.28 | 2.37 | 2.15 |
| 23.04.2024 | 2.52 | 2.71 | 2.37 |
| 22.04.2024 | 2.72 | 2.83 | 2.71 |
| 21.04.2024 | 2.86 | 3.07 | 2.71 |
| 20.04.2024 | 3 | 3.32 | 2.37 |
| 19.04.2024 | 2.27 | 2.48 | 2.15 |
© Bayerisches Landesamt für Umwelt 2024