

Chart of year Lechbruck / Lech
Discharge from 08.12.2024 to 07.12.2025
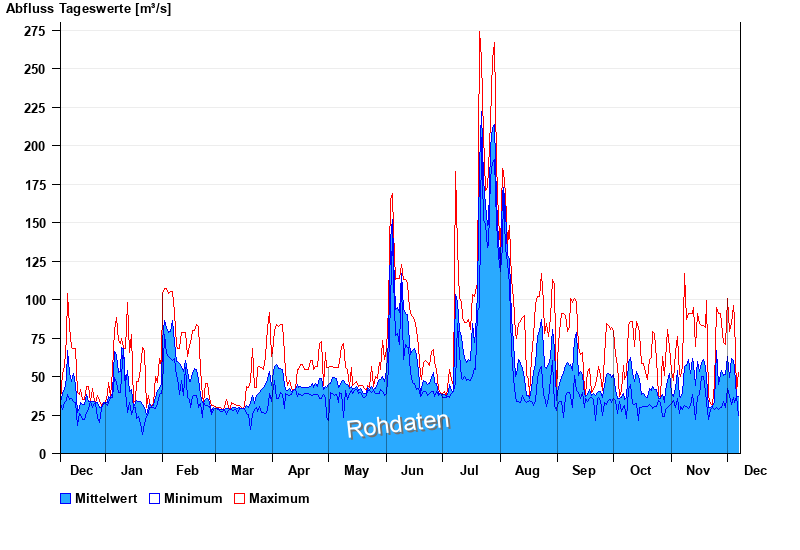
note
Messwerte beeinflusst durch Kraftwerkssteuerung.
| Date | Mean value [m³/s] | Maximum [m³/s] | Minimum [m³/s] |
|---|---|---|---|
| 07.12.2025 | 37 | 52.4 | 24.5 |
| 06.12.2025 | 37.7 | 40.1 | 37.3 |
| 05.12.2025 | 55.5 | 87 | 33.3 |
| 04.12.2025 | 60.5 | 96.2 | 36.5 |
| 03.12.2025 | 61.4 | 84.3 | 32 |
| 02.12.2025 | 49.3 | 79.2 | 37.9 |
| 01.12.2025 | 63.1 | 101 | 42.4 |
© Bayerisches Landesamt für Umwelt 2025