

Chart of total period Landau / Isar
Discharge from 01.11.1925 to 19.04.2024
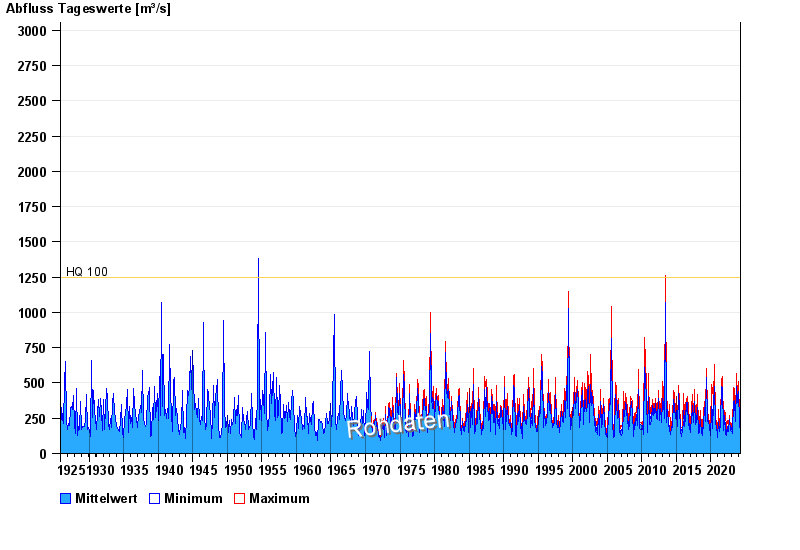
- HQ100 1250 m³/s
| Date | Mean value [m³/s] | Maximum [m³/s] | Minimum [m³/s] |
|---|---|---|---|
| 19.04.2024 | 150 | 158 | 137 |
| 18.04.2024 | 155 | 165 | 137 |
| 17.04.2024 | 131 | 140 | 118 |
| 16.04.2024 | 131 | 155 | 118 |
| 15.04.2024 | 125 | 129 | 114 |
| 14.04.2024 | 116 | 133 | 103 |
| 13.04.2024 | 113 | 126 | 103 |
© Bayerisches Landesamt für Umwelt 2024