

Chart of total period Kösfeld / Sulzbach
Discharge from 01.11.1985 to 25.04.2024
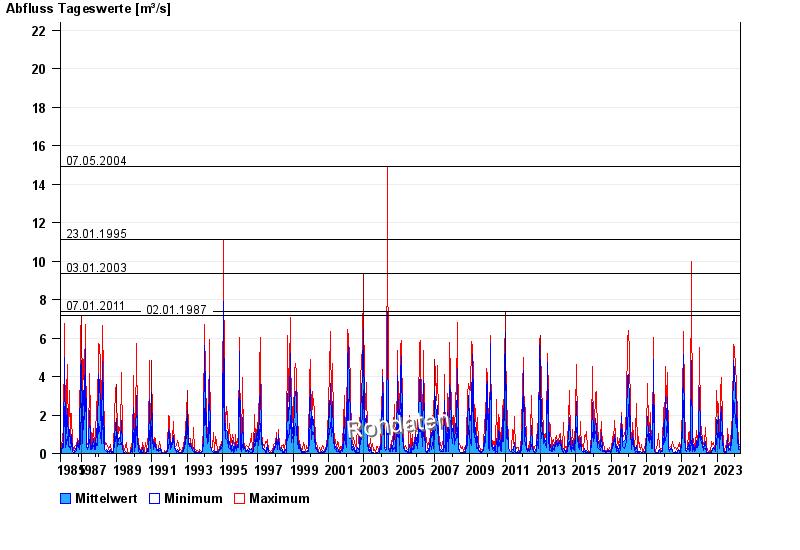
- 07.05.2004 Abfluss: 14,9 m³/s
- 23.01.1995 Abfluss: 11,1 m³/s
- 03.01.2003 Abfluss: 9,33 m³/s
- 07.01.2011 Abfluss: 7,36 m³/s
- 02.01.1987 Abfluss: 7,15 m³/s
| Date | Mean value [m³/s] | Maximum [m³/s] | Minimum [m³/s] |
|---|---|---|---|
| 25.04.2024 | 0.147 | 0.192 | 0.127 |
| 24.04.2024 | 0.143 | 0.298 | 0.127 |
| 23.04.2024 | 0.15 | 0.164 | 0.138 |
| 22.04.2024 | 0.172 | 0.206 | 0.151 |
| 21.04.2024 | 0.266 | 0.332 | 0.192 |
| 20.04.2024 | 0.23 | 0.35 | 0.164 |
| 19.04.2024 | 0.211 | 0.425 | 0.104 |
© Bayerisches Landesamt für Umwelt 2024