
- Start >
- Rivers >
- Discharge >
- Bayern >
- Iglersreuth Speicherzufluss >
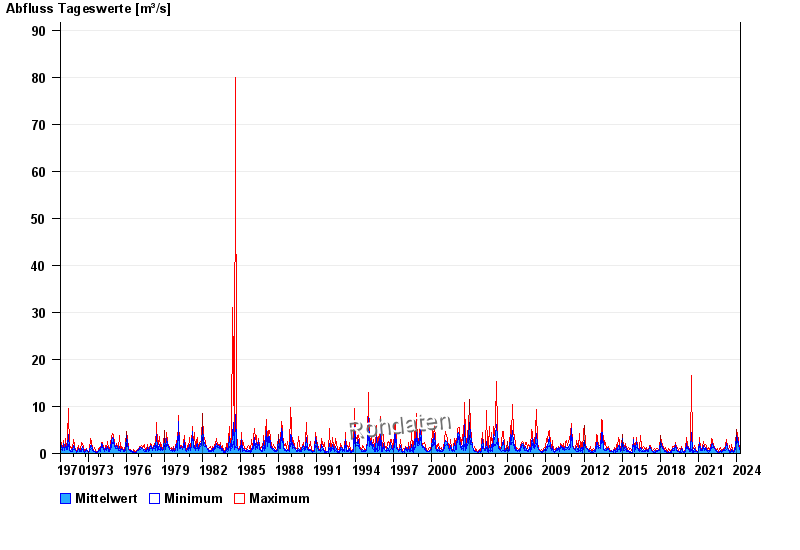
- Chart of total period

Chart of total period Iglersreuth Speicherzufluss / Tirschenreuther Waldnaab
Discharge from 01.11.1970 to 20.04.2024
| Date | Mean value [m³/s] | Maximum [m³/s] | Minimum [m³/s] |
|---|---|---|---|
| 20.04.2024 | 0.935 | 0.935 | 0.935 |
| 19.04.2024 | 0.708 | 0.935 | 0.583 |
| 18.04.2024 | 0.634 | 0.666 | 0.583 |
| 17.04.2024 | 0.743 | 0.888 | 0.666 |
| 16.04.2024 | 0.676 | 0.935 | 0.583 |
| 15.04.2024 | 0.579 | 0.625 | 0.543 |
| 14.04.2024 | 0.574 | 0.625 | 0.543 |
© Bayerisches Landesamt für Umwelt 2024