
- Start >
- Rivers >
- Discharge >
- Bayern >
- Hörmanshofen >
- Chart of year

Chart of year Hörmanshofen / Geltnach
Discharge from 01.01.2024 to 25.04.2024
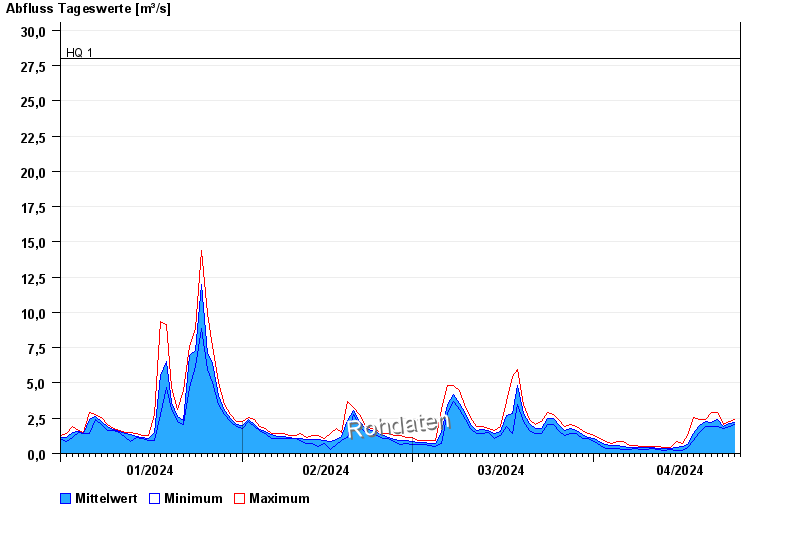
- HQ1 28 m³/s
- HQ2 33 m³/s
- HQ5 40 m³/s
- HQ10 48 m³/s
- HQ20 56 m³/s
- HQ50 67 m³/s
- HQ100 75 m³/s
| Date | Mean value [m³/s] | Maximum [m³/s] | Minimum [m³/s] |
|---|---|---|---|
| 25.04.2024 | 2.38 | 2.4 | 2.24 |
| 24.04.2024 | 2.11 | 2.24 | 1.93 |
| 23.04.2024 | 1.92 | 2.09 | 1.79 |
| 22.04.2024 | 2.44 | 2.92 | 1.93 |
| 21.04.2024 | 2.23 | 2.92 | 1.93 |
| 20.04.2024 | 2.28 | 2.4 | 1.93 |
| 19.04.2024 | 1.96 | 2.4 | 1.52 |
© Bayerisches Landesamt für Umwelt 2024