

Chart of total period Hölle / Selbitz
Discharge from 01.11.1947 to 19.04.2024
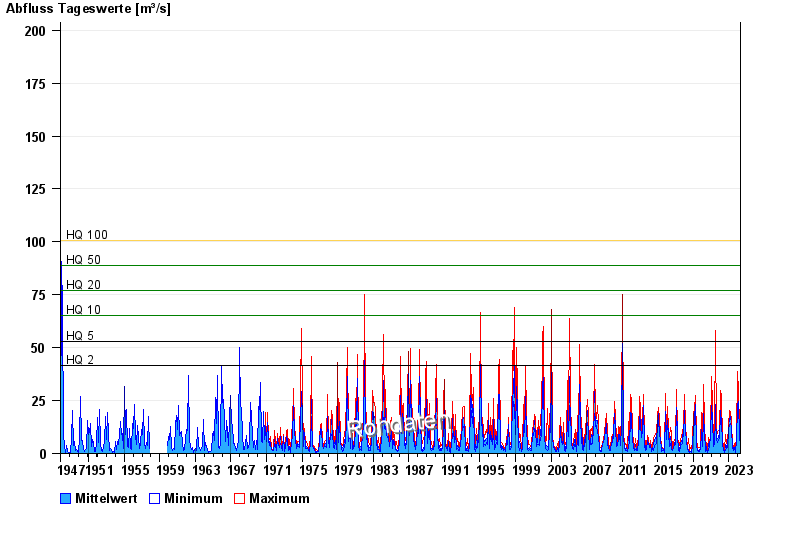
- HQ2 41,8 m³/s
- HQ5 52,7 m³/s
- HQ10 65,1 m³/s
- HQ20 76,8 m³/s
- HQ50 88,6 m³/s
- HQ100 101 m³/s
| Date | Mean value [m³/s] | Maximum [m³/s] | Minimum [m³/s] |
|---|---|---|---|
| 19.04.2024 | 2.35 | 2.62 | 2.05 |
| 18.04.2024 | 2.5 | 3.02 | 2.05 |
| 17.04.2024 | 2.52 | 3.16 | 2.15 |
| 16.04.2024 | 2.24 | 3.61 | 1.59 |
| 15.04.2024 | 1.76 | 1.95 | 1.59 |
| 14.04.2024 | 1.79 | 2.05 | 1.59 |
| 13.04.2024 | 1.84 | 2.05 | 1.67 |
© Bayerisches Landesamt für Umwelt 2024