

Chart of total period Höll / Schwarzach
Discharge from 01.11.1967 to 20.04.2024
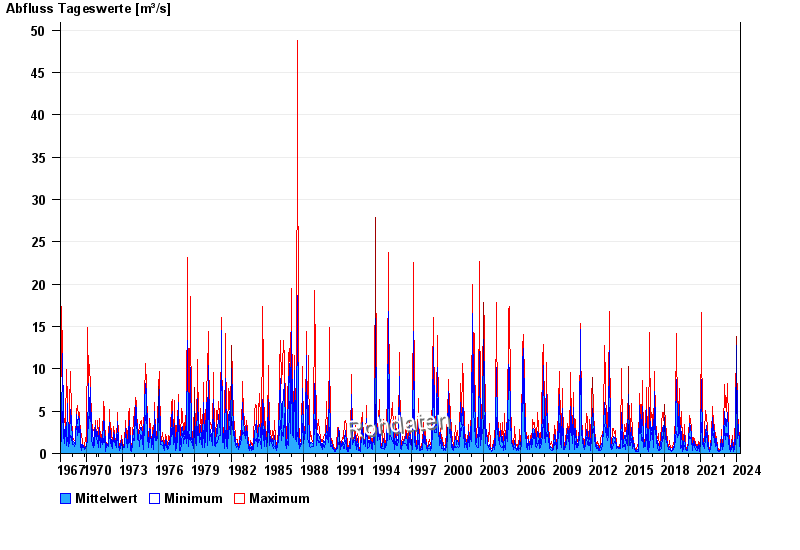
| Date | Mean value [m³/s] | Maximum [m³/s] | Minimum [m³/s] |
|---|---|---|---|
| 20.04.2024 | 3.57 | 3.63 | 3.43 |
| 19.04.2024 | 1.63 | 3.43 | 1.11 |
| 18.04.2024 | 1.52 | 1.73 | 1.29 |
| 17.04.2024 | 0.944 | 1.29 | 0.882 |
| 16.04.2024 | 0.666 | 0.939 | 0.498 |
| 15.04.2024 | 0.541 | 0.625 | 0.423 |
| 14.04.2024 | 0.468 | 0.538 | 0.388 |
© Bayerisches Landesamt für Umwelt 2024