

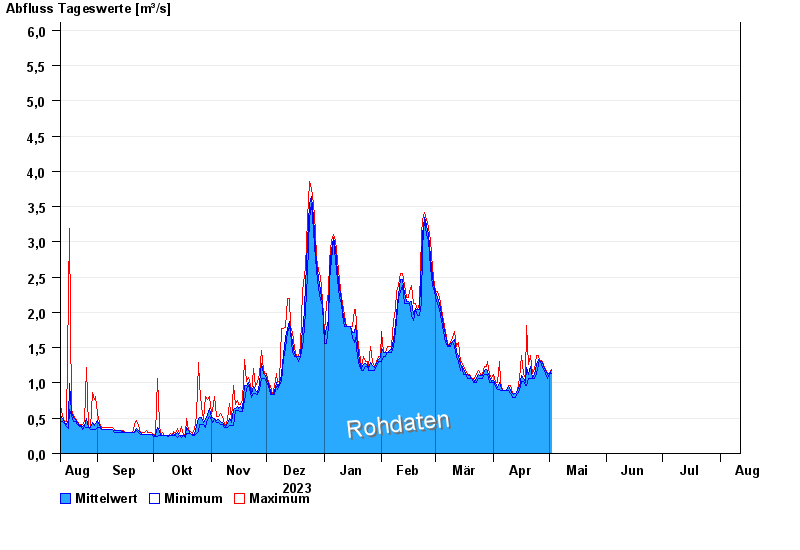
Chart of year Hobbach / Elsava
Discharge from 12.08.2023 to 11.08.2024
- 14.01.2011 Abfluss: 13,5 m³/s
- 27.01.1995 Abfluss: 11,1 m³/s
- 01.06.2013 Abfluss: 7,61 m³/s
- 04.03.2008 Abfluss: 7,51 m³/s
- 15.04.1994 Abfluss: 7,42 m³/s
| Date | Mean value [m³/s] | Maximum [m³/s] | Minimum [m³/s] |
|---|---|---|---|
| 18.04.2024 | 1.02 | 1.02 | 0.961 |
| 17.04.2024 | 1.06 | 1.14 | 1.02 |
| 16.04.2024 | 1.1 | 1.39 | 1.02 |
| 15.04.2024 | 0.95 | 1.07 | 0.899 |
| 14.04.2024 | 0.886 | 0.899 | 0.852 |
| 13.04.2024 | 0.844 | 0.852 | 0.798 |
| 12.04.2024 | 0.834 | 0.852 | 0.798 |
© Bayerisches Landesamt für Umwelt 2024