

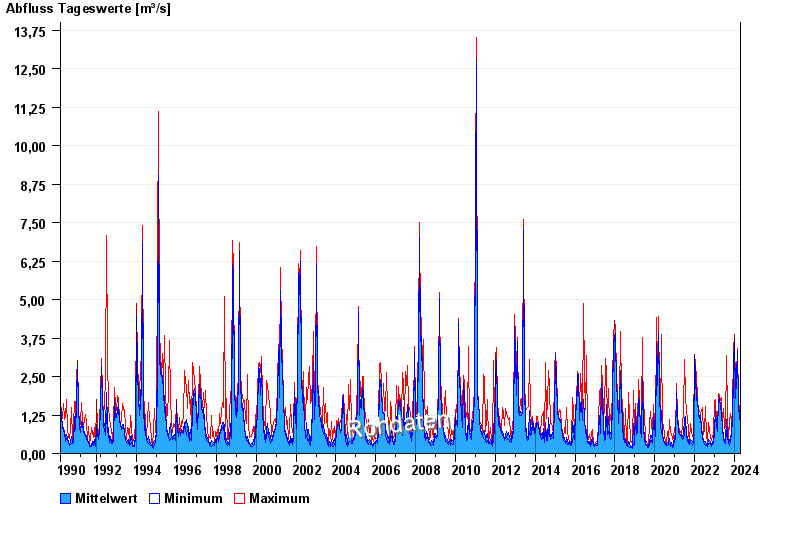
Chart of total period Hobbach / Elsava
Discharge from 05.03.1990 to 20.04.2024
| Date | Mean value [m³/s] | Maximum [m³/s] | Minimum [m³/s] |
|---|---|---|---|
| 20.04.2024 | 1.21 | 1.26 | 1.19 |
| 19.04.2024 | 1.22 | 1.82 | 0.961 |
| 18.04.2024 | 1.01 | 1.07 | 0.961 |
| 17.04.2024 | 1.06 | 1.14 | 1.02 |
| 16.04.2024 | 1.1 | 1.39 | 1.02 |
| 15.04.2024 | 0.95 | 1.07 | 0.899 |
| 14.04.2024 | 0.886 | 0.899 | 0.852 |
© Bayerisches Landesamt für Umwelt 2024