
- Start >
- Rivers >
- Discharge >
- Bayern >
- Heinersdorf >
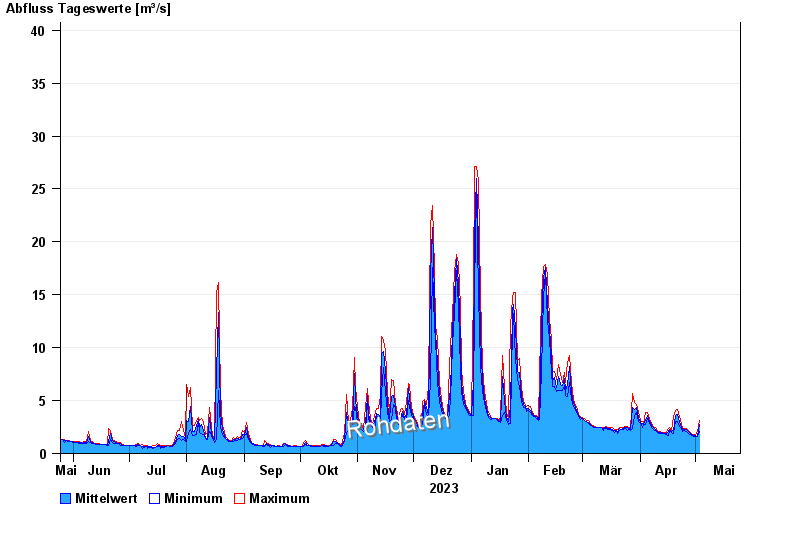
- Chart of year

Chart of year Heinersdorf / Rodach
Discharge from 25.05.2023 to 24.05.2024
- 03.01.2003 Abfluss: 86,6 m³/s
- 24.12.1967 Abfluss: 73,2 m³/s
- 08.05.2004 Abfluss: 68,3 m³/s
- 23.02.1970 Abfluss: 67,9 m³/s
- 14.01.2011 Abfluss: 67,6 m³/s
| Date | Mean value [m³/s] | Maximum [m³/s] | Minimum [m³/s] |
|---|---|---|---|
| 23.04.2024 | 2.47 | 2.73 | 2.34 |
| 22.04.2024 | 3 | 3.54 | 2.53 |
| 21.04.2024 | 3.69 | 4.19 | 2.99 |
| 20.04.2024 | 3.63 | 4.11 | 3.06 |
| 19.04.2024 | 2.2 | 3.47 | 1.93 |
| 18.04.2024 | 2.06 | 2.22 | 1.99 |
| 17.04.2024 | 2.29 | 2.41 | 2.16 |
© Bayerisches Landesamt für Umwelt 2024