
- Start >
- Rivers >
- Discharge >
- Bayern >
- Heinersdorf >
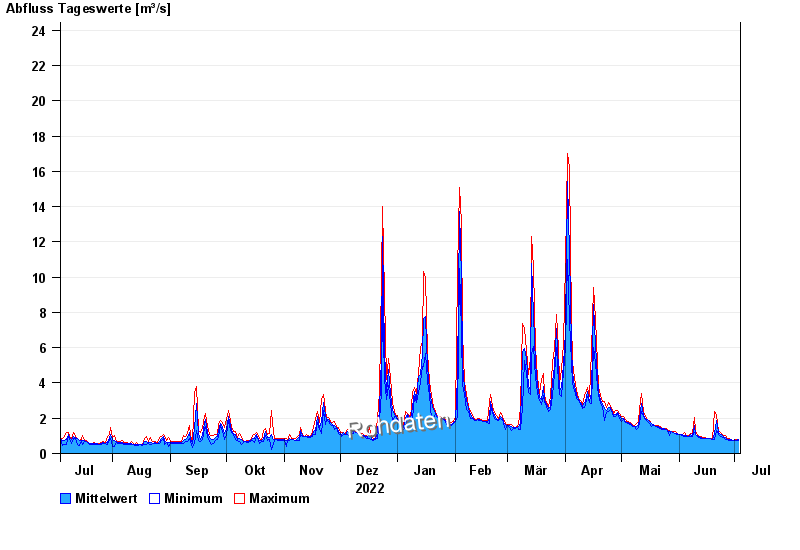
- Chart of year

Chart of year Heinersdorf / Rodach
Discharge from 04.07.2022 to 03.07.2023
- 03.01.2003 Abfluss: 86,6 m³/s
- 24.12.1967 Abfluss: 73,2 m³/s
- 08.05.2004 Abfluss: 68,3 m³/s
- 23.02.1970 Abfluss: 67,9 m³/s
- 14.01.2011 Abfluss: 67,6 m³/s
| Date | Mean value [m³/s] | Maximum [m³/s] | Minimum [m³/s] |
|---|---|---|---|
| 03.07.2023 | 0.774 | 0.8 | 0.731 |
| 02.07.2023 | 0.757 | 0.8 | 0.731 |
| 01.07.2023 | 0.766 | 0.8 | 0.765 |
| 30.06.2023 | 0.765 | 0.765 | 0.765 |
| 29.06.2023 | 0.766 | 0.8 | 0.765 |
| 28.06.2023 | 0.795 | 0.836 | 0.765 |
| 27.06.2023 | 0.811 | 0.836 | 0.8 |
© Bayerisches Landesamt für Umwelt 2024