
- Start >
- Rivers >
- Discharge >
- Bayern >
- Heinersdorf >
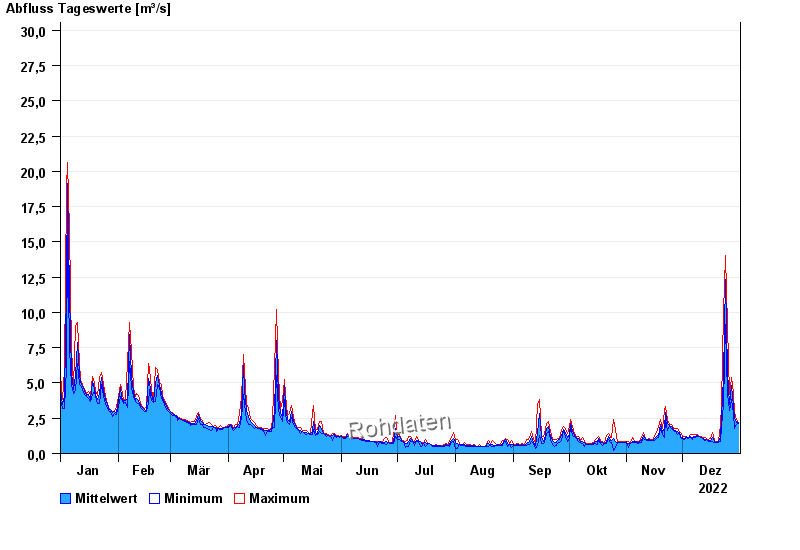
- Chart of year

Chart of year Heinersdorf / Rodach
Discharge from 01.01.2022 to 31.12.2022
- 03.01.2003 Abfluss: 86,6 m³/s
- 24.12.1967 Abfluss: 73,2 m³/s
- 08.05.2004 Abfluss: 68,3 m³/s
- 23.02.1970 Abfluss: 67,9 m³/s
- 14.01.2011 Abfluss: 67,6 m³/s
| Date | Mean value [m³/s] | Maximum [m³/s] | Minimum [m³/s] |
|---|---|---|---|
| 31.12.2022 | 2.17 | 2.19 | 2.13 |
| 30.12.2022 | 2.2 | 2.38 | 2.08 |
| 29.12.2022 | 2.52 | 2.88 | 1.79 |
| 28.12.2022 | 3.35 | 4.25 | 2.82 |
| 27.12.2022 | 4.79 | 5.37 | 3.83 |
| 26.12.2022 | 3.45 | 4.18 | 3.08 |
| 25.12.2022 | 5.75 | 9.04 | 4.18 |
© Bayerisches Landesamt für Umwelt 2024