
- Start >
- Rivers >
- Discharge >
- Bayern >
- Heinersdorf >
- Chart of year

Chart of year Heinersdorf / Rodach
Discharge from 01.07.2022 to 30.06.2023
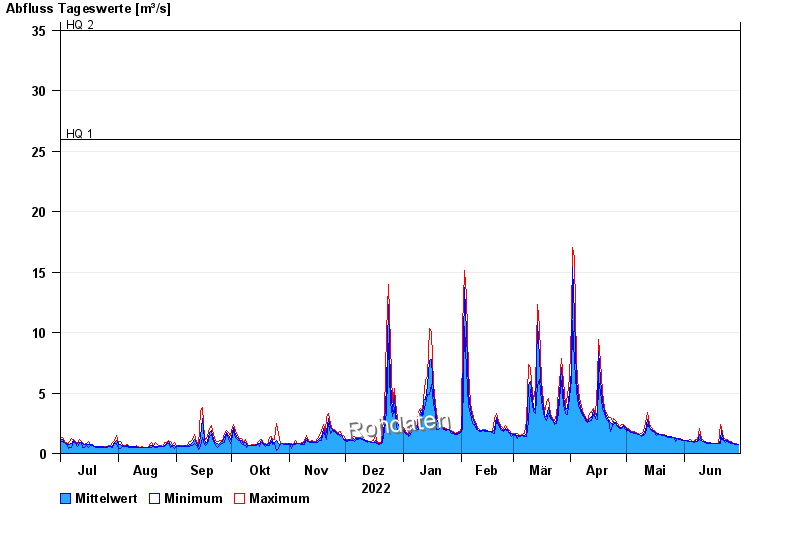
- HQ1 26 m³/s
- HQ2 35 m³/s
- HQ5 45 m³/s
- HQ10 55 m³/s
- HQ20 66 m³/s
- HQ50 80 m³/s
- HQ100 95 m³/s
| Date | Mean value [m³/s] | Maximum [m³/s] | Minimum [m³/s] |
|---|---|---|---|
| 30.06.2023 | 0.765 | 0.765 | 0.765 |
| 29.06.2023 | 0.766 | 0.8 | 0.765 |
| 28.06.2023 | 0.795 | 0.836 | 0.765 |
| 27.06.2023 | 0.811 | 0.836 | 0.8 |
| 26.06.2023 | 0.906 | 1.03 | 0.8 |
| 25.06.2023 | 0.972 | 1.03 | 0.912 |
| 24.06.2023 | 1.06 | 1.15 | 0.989 |
© Bayerisches Landesamt für Umwelt 2024