
- Start >
- Rivers >
- Discharge >
- Bayern >
- Heinersdorf >
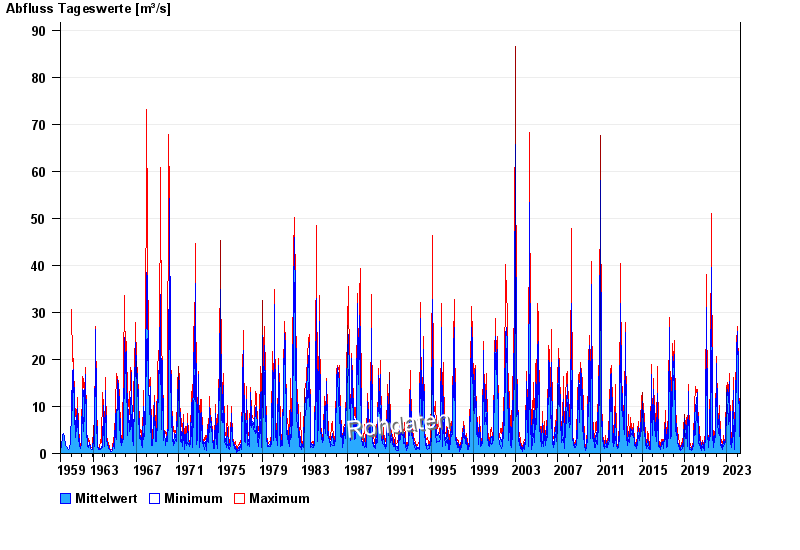
- Chart of total period

Chart of total period Heinersdorf / Rodach
Discharge from 01.11.1959 to 24.04.2024
| Date | Mean value [m³/s] | Maximum [m³/s] | Minimum [m³/s] |
|---|---|---|---|
| 24.04.2024 | 2.23 | 2.34 | 2.11 |
| 23.04.2024 | 2.46 | 2.73 | 2.34 |
| 22.04.2024 | 3 | 3.54 | 2.53 |
| 21.04.2024 | 3.69 | 4.19 | 2.99 |
| 20.04.2024 | 3.63 | 4.11 | 3.06 |
| 19.04.2024 | 2.2 | 3.47 | 1.93 |
| 18.04.2024 | 2.06 | 2.22 | 1.99 |
© Bayerisches Landesamt für Umwelt 2024