
- Start >
- Rivers >
- Discharge >
- Bayern >
- Haberkofen >
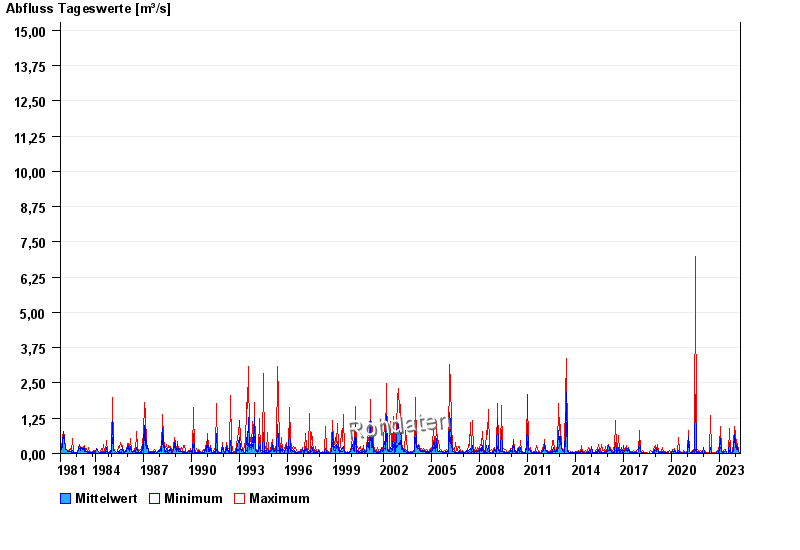
- Chart of total period

Chart of total period Haberkofen / Ödbach
Discharge from 01.11.1981 to 25.04.2024
 Für diesen Pegel sind keine Jährlichkeiten hinterlegt.
| Date | Mean value [m³/s] | Maximum [m³/s] | Minimum [m³/s] |
|---|---|---|---|
| 25.04.2024 | 0.023 | 0.037 | 0.018 |
| 24.04.2024 | 0.022 | 0.026 | 0.018 |
| 23.04.2024 | 0.022 | 0.026 | 0.018 |
| 22.04.2024 | 0.023 | 0.026 | 0.022 |
| 21.04.2024 | 0.027 | 0.051 | 0.018 |
| 20.04.2024 | 0.024 | 0.031 | 0.022 |
| 19.04.2024 | 0.022 | 0.026 | 0.018 |
© Bayerisches Landesamt für Umwelt 2024