
- Start >
- Rivers >
- Discharge >
- Bayern >
- Güntersthal >
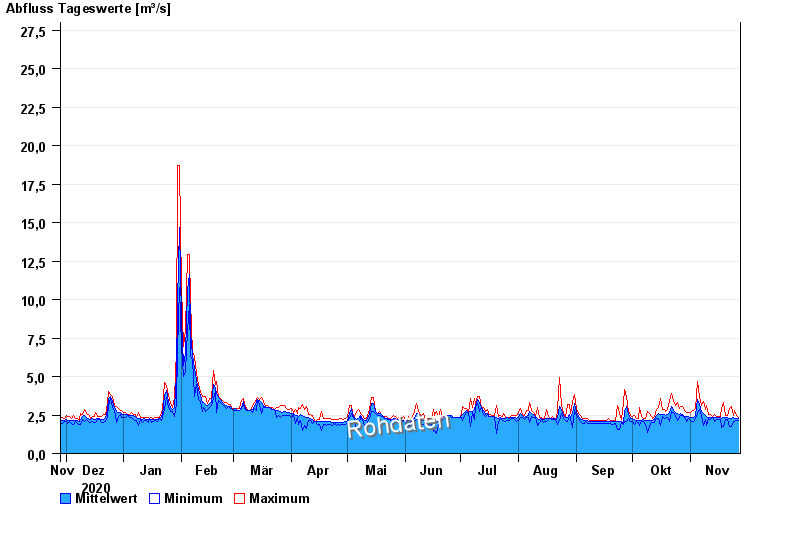
- Chart of year

Chart of year Güntersthal / Pegnitz
Discharge from 28.11.2020 to 27.11.2021
- 23.02.1970 Abfluss: 50,9 m³/s
- 26.01.1995 Abfluss: 48,2 m³/s
- 03.01.2003 Abfluss: 40,6 m³/s
- 21.12.1993 Abfluss: 37 m³/s
- 14.01.2011 Abfluss: 36,6 m³/s
| Date | Mean value [m³/s] | Maximum [m³/s] | Minimum [m³/s] |
|---|---|---|---|
| 27.11.2021 | 2.29 | 2.37 | 2.17 |
| 26.11.2021 | 2.28 | 2.47 | 2.16 |
| 25.11.2021 | 2.3 | 2.81 | 2.06 |
| 24.11.2021 | 2.32 | 2.46 | 2.06 |
| 23.11.2021 | 2.3 | 3.05 | 1.78 |
| 22.11.2021 | 2.27 | 2.92 | 1.77 |
| 21.11.2021 | 2.34 | 2.45 | 2.24 |
© Bayerisches Landesamt für Umwelt 2024